Recycled-content commitments by consumer packaged goods companies and fashion brands have driven demand for recycled polyethylene terephthalate (RPET) to a level that exceeds available supply.

Recycled-content commitments by consumer packaged goods companies and fashion brands have driven demand for recycled polyethylene terephthalate (RPET) to a level that exceeds available supply.
The Continuous Improvement Fund wrote that China’s National Sword campaign increased sorting costs and drove down commodity sales revenues in Ontario. | joi54/Shutterstock
China’s National Sword and the evolving packaging stream have pushed up net recycling costs by nearly 13% in Canada’s largest province.
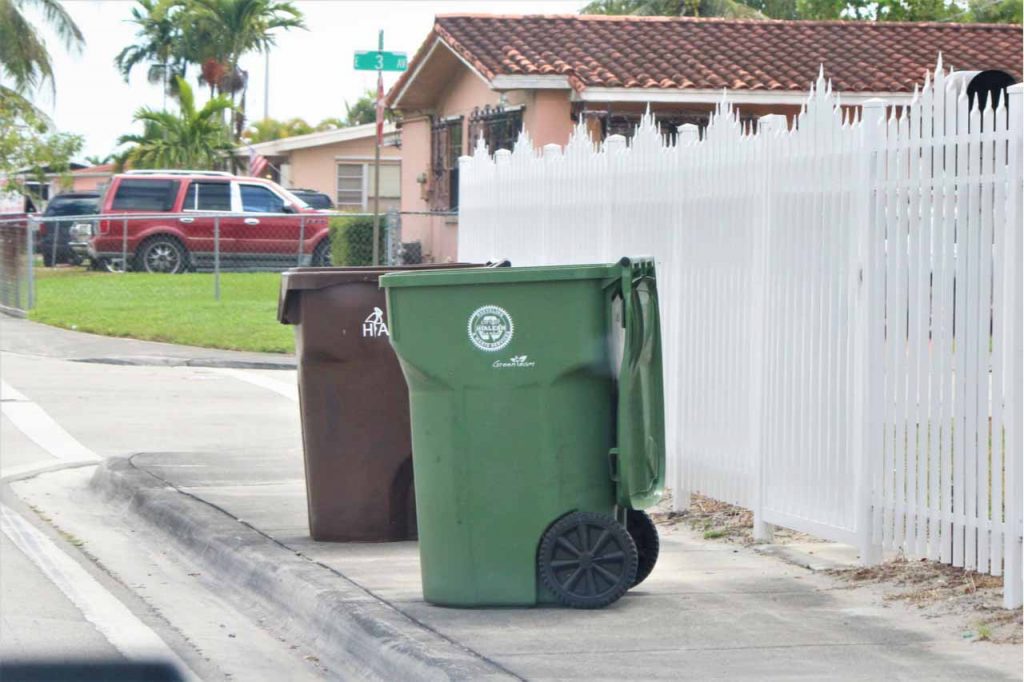
Researchers in Florida have noticed a gradual increase in contamination rates in recent years. | Blueee77/Shutterstock
MRFs in Florida have historically landfilled about one-quarter of the weight that comes in the door, according to a study commissioned by the Florida Recycling Partnership Foundation.
In America’s most populous state, recycled-content percentages in key products using recovered glass had been falling, but new numbers from California officials show a halt to that trend.

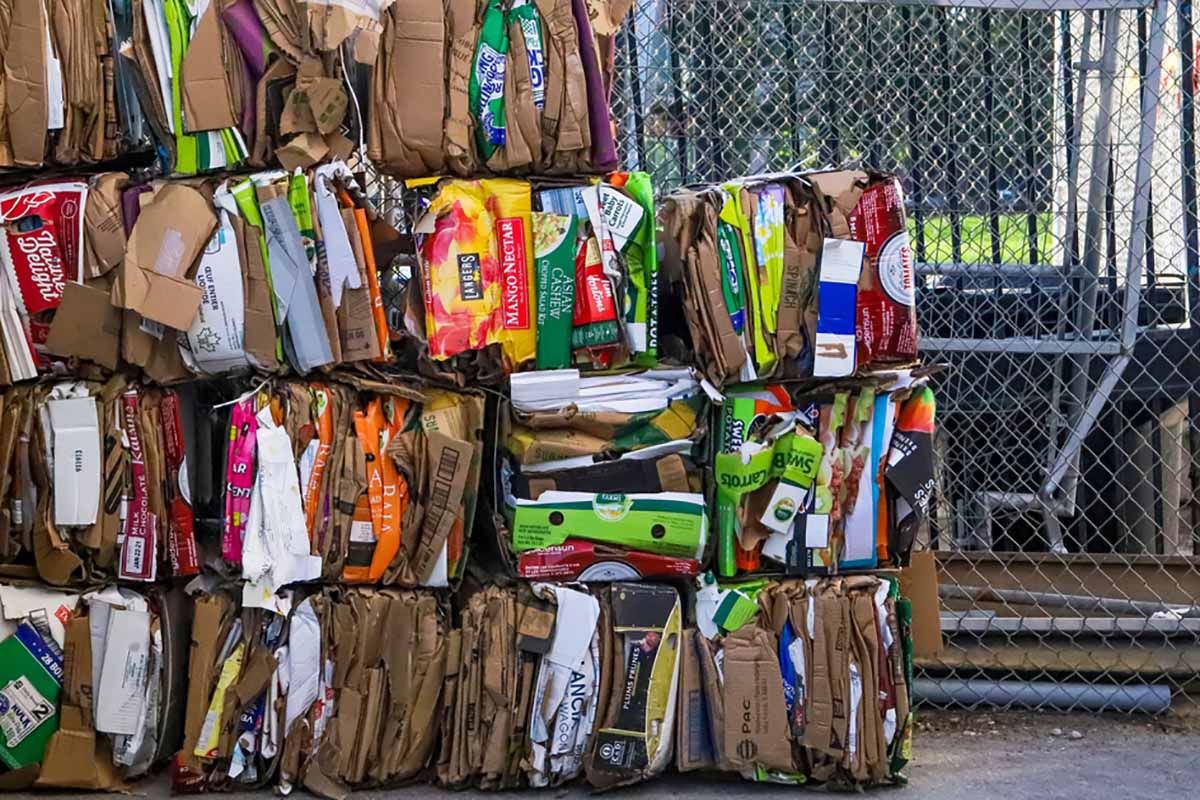
Industry group American Forest & Paper Association announced that in the U.S. market 49 million short tons of fiber products were recycled in 2019.| franz12/Shutterstock
Export market turmoil caused a lower recycling rate for paper and paperboard in 2019, an industry group announced. The decline comes after a record year for paper recycling in 2018.

Technology developer Zabble is working with the University of California, San Francisco to reduce waste and increase diversion. | David Tran Photo/Shutterstock
A data collection and analytics platform is helping a California university improve its landfill diversion. In recent weeks, the platform has also helped combat the spread of COVID-19.

California will fall short of its 75% recycling rate goal for 2020, state officials acknowledged in a recent report. | Johnny Habell/Shutterstock
California and Oregon recently reported lower statewide diversion rates, a trend that’s been ongoing for multiple years in both states.