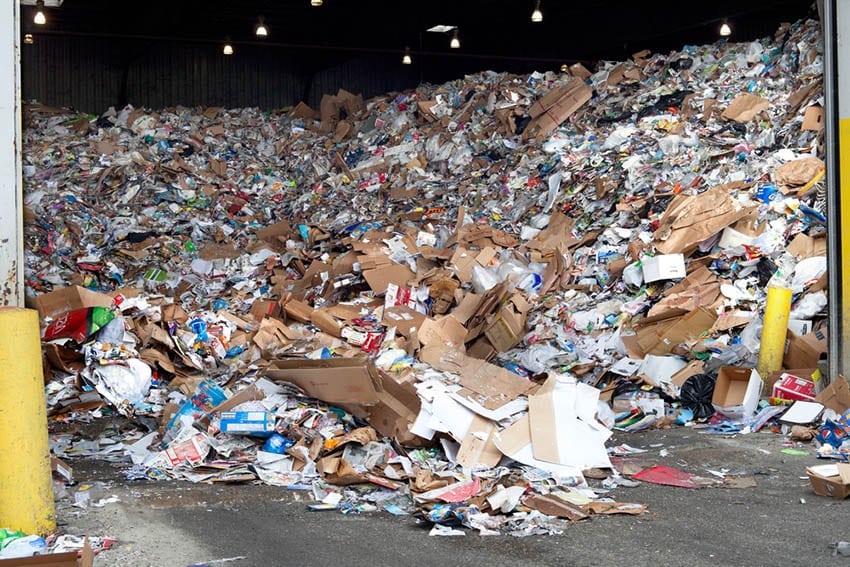
A report from plastics industry group NAPCOR indicated the U.S. PET bottle recycling rate was 28.9% in 2018, down from 29.2% in 2017. | pook jun/Shutterstock
The U.S. recycling rates for both PET bottles and all plastic bottles have fallen slightly, according to two reports released by industry groups.
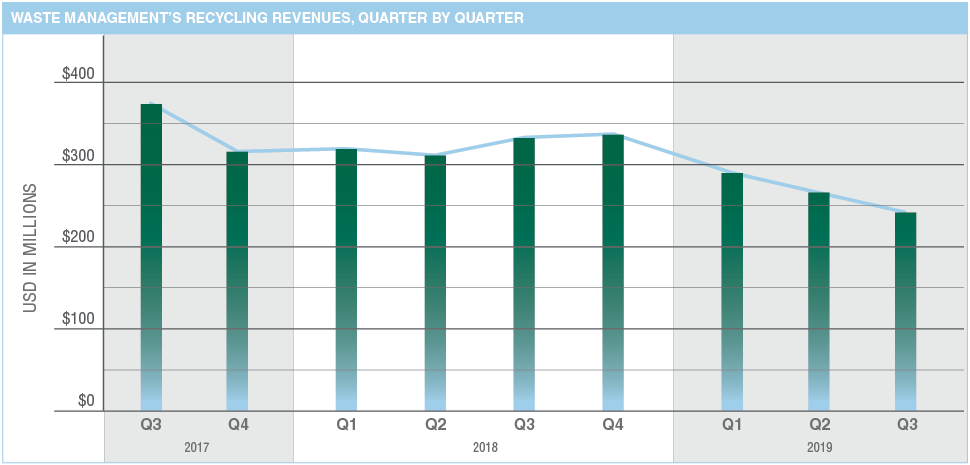
The impact of the seismic shift in recycling markets over the past two-and-a-half years can be clearly seen in the quarterly recycling revenue numbers of Waste Management, which operates roughly 100 materials recovery facilities in North America.
The publicly traded company has seen its quarterly recycling-related revenue decline 35% (from $375 million to $245 million) since the third quarter of 2017. In July of 2017, China announced its intention to ban many categories of recyclables, and the policy was implemented at the start of 2018.
Values for many key curbside materials have dropped significantly since then.
Information for this month’s Data Corner came from Waste Management’s publicly available earnings reports.
This article originally appeared in the November 2019 issue of Resource Recycling. Subscribe today for access to all print content.
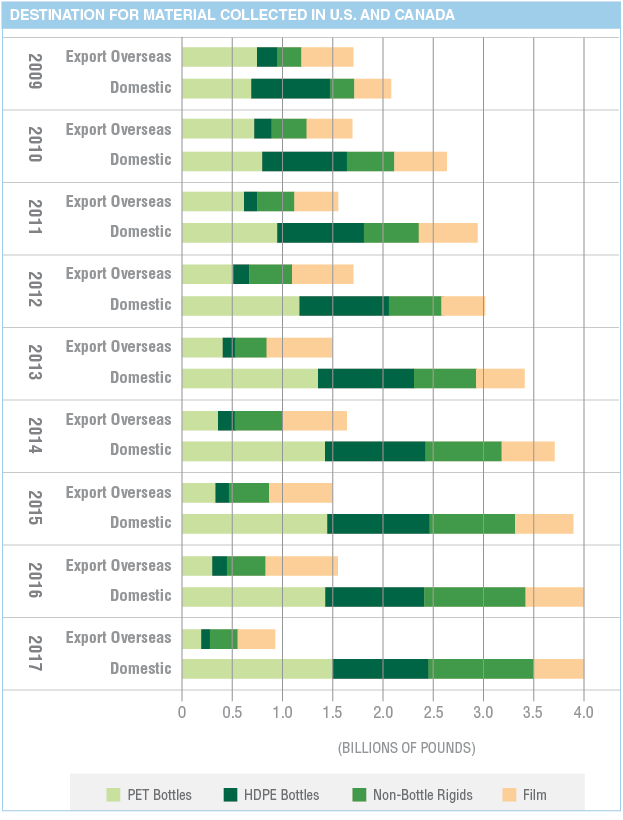
The graph below shows the downstream trends for four major plastic resins collected for recycling in the U.S. and Canada going back to 2009 (the graph stops at 2017 because that is the most recent year for which figures are available).
From 2009 to 2016, the total amount of post-consumer plastic exported to overseas markets from the U.S. and Canada stayed relatively stable, but that number dropped considerably in 2017. That fact is hardly surprising: China stated in 2017 that it was planning to implement its import ban on many grades of recovered material at the outset of 2018, and the announcement itself caused major market shifts.
On the domestic processing front, the total amount climbed steadily before plateauing between 2016 and 2017. With more material needing a home as many Asian markets enact restrictions, opportunity exists for continued domestic processing growth. The keys will be infrastructure improvements to deliver cleaner loads to plastic reclaimers and greater end market demand for the recycled resins.
This month’s Data Corner was produced by More Recycling.
This article appeared in the October 2019 issue of Resource Recycling. Subscribe today for access to all print content.
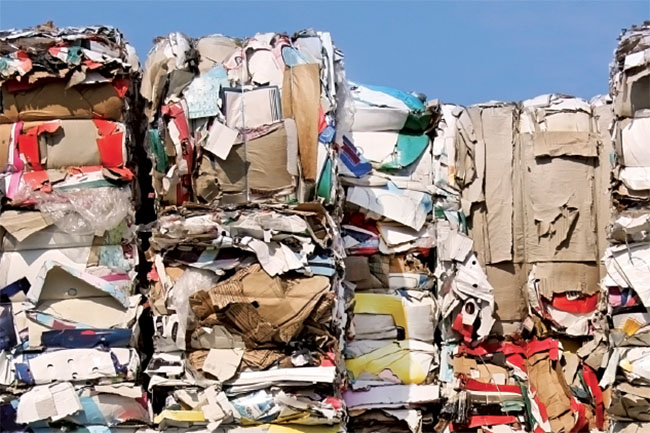
The U.S. paper recovery rate has been at or above 63% each year for the past decade.
Every year, the American Forest & Paper Association (AF&PA) releases the U.S. paper recovery for recycling rate. The annual figure informs us how much recovered paper is being used to create new products in a given year and is also an important indicator of how much paper and paper-based packaging is kept out of landfills after use.
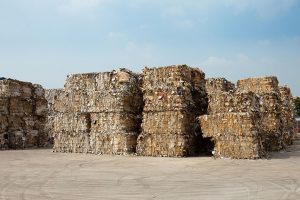
Consumption of U.S. recovered fiber versus overall finished paper products sold into the market hit a record high percentage in 2018. An industry group explained the increase, which came amid market challenges.