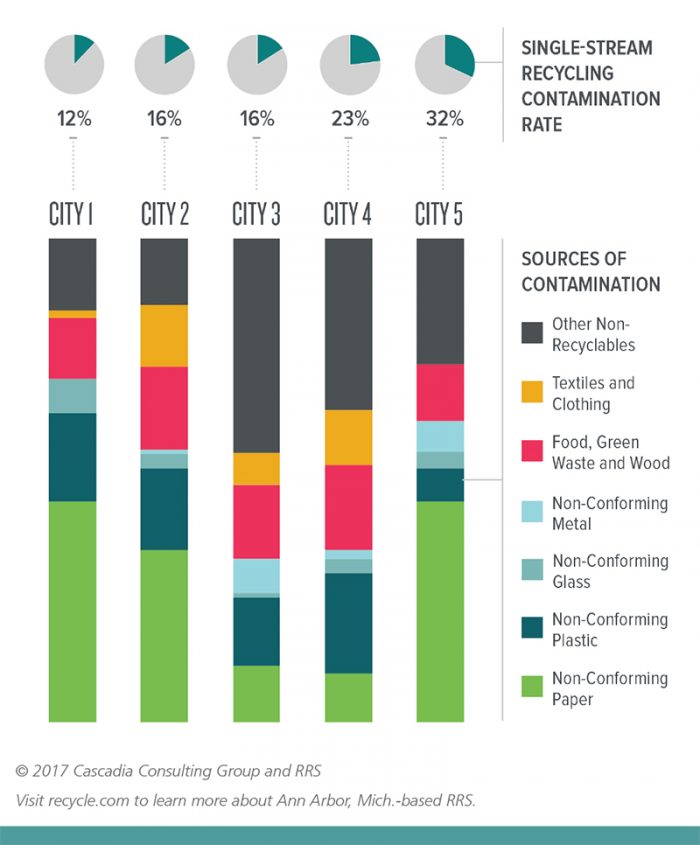
Cascadia Consulting Group compiled single-family recycling composition data utilizing studies conducted in the past three years in five western and southern U.S. cities.
The five municipalities all operate single-stream recycling collection and have populations ranging from 600,000 to 2.2 million. The chart below provides a breakout of types and amounts of contaminants, defined as materials not accepted in the programs.
Although contamination rates ranged widely – from 12 to 32 percent – researchers found consistency in terms of material types: non-conforming paper; food, green waste and wood; and other non-recyclables.
Data Corner is compiled monthly by recycling consultancy RRS. For this edition, the company collaborated with Cascadia Consulting.
This article originally appeared in the June 2017 issue of Resource Recycling. Subscribe today for access to all print content.
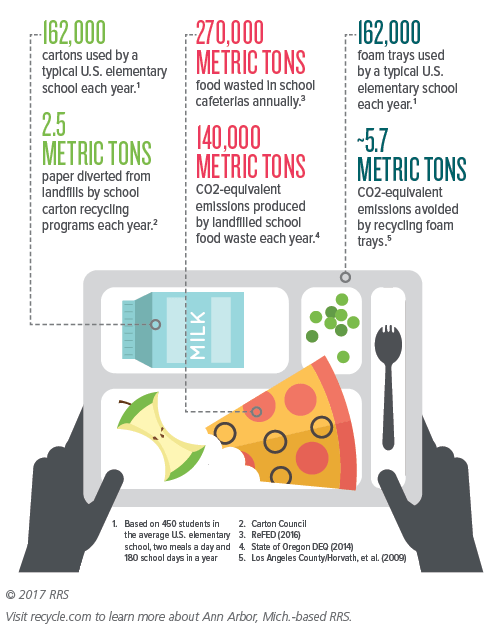
As educational leaders take their much-deserved summer breather, they might finally have some time to consider how to bolster materials recovery in schools.
The cafeteria could be a great place to start. Resources are available to help schools set up or enhance their recycling/composting programs to recover food waste and recyclables, including some often-overlooked materials like cartons and foam trays.
Schools can play a sustainable role in the community while teaching the students about responsible living – a lesson that can then transfer back into their homes.
Data Corner is compiled monthly by recycling consultancy RRS.
This article originally appeared in the July 2017 issue of Resource Recycling. Subscribe today for access to all print content.
RRS analyzed commodity pricing from several published reports to compare U.S. and European pricing data for recycled fiber and glass.
Although making a precise comparison is challenging due to differences in traded grades and local composition, the findings nonetheless highlight divergences in pricing between the two jurisdictions.
The differences can likely be attributed to the large source-separated collection footprint in Europe, which delivers quality glass and fiber to the market.
This is supported by the fact that materials recovery facilities (MRFs) in Europe see similar pricing to U.S. MRFs on glass collected in single-stream systems, due to the need for secondary cleaning and sorting.
![]()
Data Corner is compiled monthly by recycling consultancy RRS.
This article originally appeared in the August 2017 issue of Resource Recycling. Subscribe today for access to all print content.
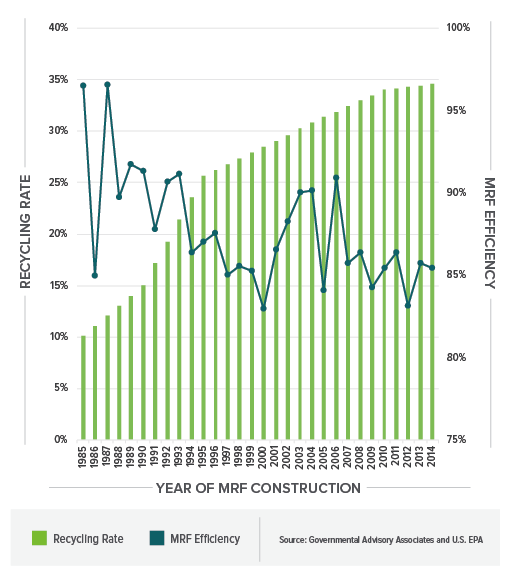
RRS compiled a sampling of nationwide data from Governmental Advisory Associates and U.S. EPA sources to show current average materials recovery facility (MRF) efficiency rates and community recycling rates based on MRF construction year.
Efficiency rates show the percentage of materials, by weight, that enter the MRF and are not discarded as residue.
Newer MRFs open the door for single-stream programs in which people throw all recyclables in one bin – this improves participation and boosts tonnages but affects sorting efficiency, resulting in more residuals.
The tradeoff is positive overall as long as the increase in recycling outweighs the decrease in efficiency. Developments in MRF technology to reflect the mix of materials in the stream can help to capture more, and education is essential to minimize contamination.
Data Corner is compiled monthly by recycling consultancy RRS.
This article originally appeared in the September 2017 issue of Resource Recycling. Subscribe today for access to all print content.
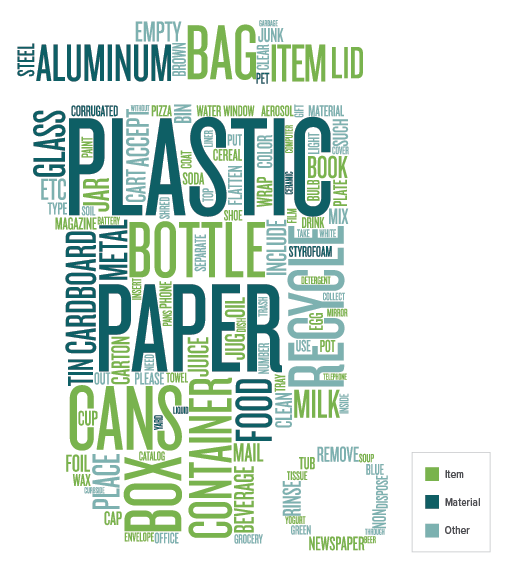
The word cloud below represents the language utilized in 1,000 residential recycling program guidelines, as reviewed by RRS.
The size of each word is proportional to its frequency of use in program education/outreach materials.
RRS also categorized the top 100 words and found that 55 percent of those terms described an item (for example, box, bottle or container); 24 percent described materials (steel, glass, plastic, etc.); and 18 percent aimed to direct behavior (place, empty, remove, etc.).
Data Corner is compiled monthly by recycling consultancy RRS.
This article originally appeared in the October 2017 issue of Resource Recycling. Subscribe today for access to all print content.
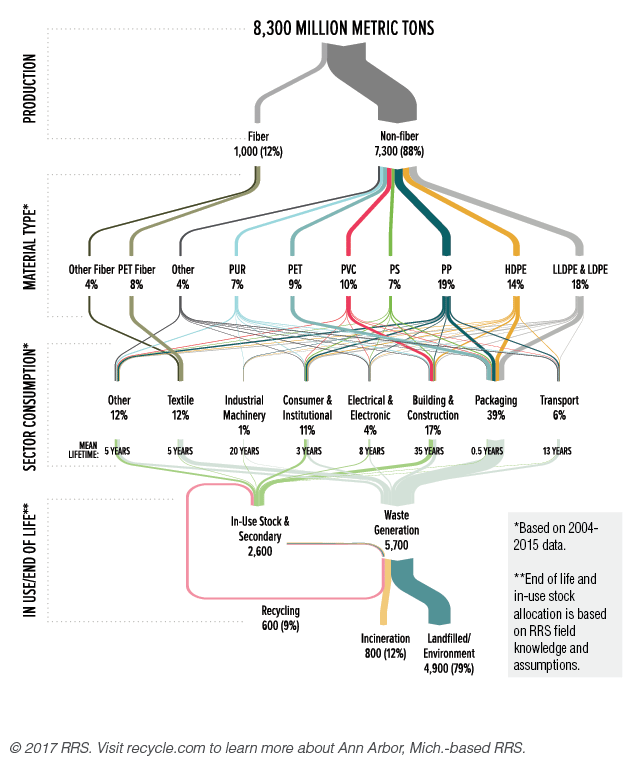
RRS utilized the data from a recent academic study, “Production, Use, and Fate of All Plastics Ever Made,” to construct a visualization of the life cycle of various plastics.
The paper, which appeared in the July edition of the journal Science Advances, determined how much virgin plastic was produced between the dawn of the plastics industry around 1950 and 2015. Researchers then estimated how much material went through different avenues.
They concluded that almost 80 percent of plastic waste generated has ended up in landfill or in our natural environment, and only 9 percent was recycled.
The study was authored by Roland Geyer of the University of California, Santa Barbara; Jenna Jambeck of the University of Georgia; and Kara Law from the Sea Education Association.
Data Corner is compiled monthly by recycling consultancy RRS.
This article originally appeared in the November 2017 issue of Resource Recycling. Subscribe today for access to all print content.