Back to Top

Category: Resource Recycling Magazine

Data Corner: Bolstering glass recycling at MRFs

Published: April 6, 2017
Updated:

by

RRS analyzed data from field reports and primary sources as well as experiential data from MRF practices across the U.S.

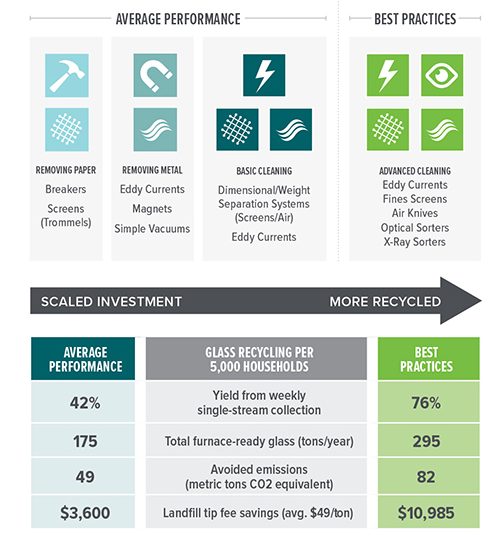
The findings show that with additional stages of advanced cleaning, glass recovery can yield increases in quantity, as well as tip fee savings and avoided emissions.

In the graphic below, typical MRF glass processing steps are shown in the “Average Performance” column, and more advanced undertakings are shown to the right. At the bottom, we’ve quantified the benefits of utilizing best practices.

Data Corner March 2017
Data Corner is compiled monthly by recycling consultancy RRS.

This article originally appeared in the March 2017 issue of Resource Recycling. Subscribe today for access to all print content.

Data Corner: 30 years of recycling rates, MRF construction and commodity pricing

Published: June 9, 2017
Updated:

by

The U.S. experienced a rapid surge in its recycling rate as capacity increased with the growth of curbside recycling programs and construction of materials recovery facilities in the late 1980s to mid-1990s.

However, the last several years have seen the increases in recycling rate level off and stagnate in a development that parallels recent commodity pricing.

While rising commodity prices will to some degree help drive increased recycling, the trends underscore the need to overcome barriers in areas such as access and resident participation.

Note: Commodity revenue numbers represent average prices for typical curbside recyclables receiving by processing facilities in the Pacific Northwest.

Data Corner is compiled monthly by recycling consultancy RRS. Visit recycle.com to learn more.

This article originally appeared in the May 2017 issue of Resource Recycling. Subscribe today for access to all print content.

Data Corner: The dirty details on contamination

Published: June 29, 2017
Updated:

by

Cascadia Consulting Group compiled single-family recycling composition data utilizing studies conducted in the past three years in five western and southern U.S. cities.

The five municipalities all operate single-stream recycling collection and have populations ranging from 600,000 to 2.2 million. The chart below provides a breakout of types and amounts of contaminants, defined as materials not accepted in the programs.

Although contamination rates ranged widely – from 12 to 32 percent – researchers found consistency in terms of material types: non-conforming paper; food, green waste and wood; and other non-recyclables.

Data Corner is compiled monthly by recycling consultancy RRS. For this edition, the company collaborated with Cascadia Consulting.

This article originally appeared in the June 2017 issue of Resource Recycling. Subscribe today for access to all print content.

Posted in Data Corner | Tagged , |

Data Corner: Possible low-hanging fruit in school lunch stream

Published: August 1, 2017
Updated:

by

As educational leaders take their much-deserved summer breather, they might finally have some time to consider how to bolster materials recovery in schools.

The cafeteria could be a great place to start. Resources are available to help schools set up or enhance their recycling/composting programs to recover food waste and recyclables, including some often-overlooked materials like cartons and foam trays.

Schools can play a sustainable role in the community while teaching the students about responsible living – a lesson that can then transfer back into their homes.

Data Corner is compiled monthly by recycling consultancy RRS.

This article originally appeared in the July 2017 issue of Resource Recycling. Subscribe today for access to all print content.

Data Corner: How the US and EU stack up on pricing

Published: September 4, 2017
Updated:

by

RRS analyzed commodity pricing from several published reports to compare U.S. and European pricing data for recycled fiber and glass.

Although making a precise comparison is challenging due to differences in traded grades and local composition, the findings nonetheless highlight divergences in pricing between the two jurisdictions.

The differences can likely be attributed to the large source-separated collection footprint in Europe, which delivers quality glass and fiber to the market.

This is supported by the fact that materials recovery facilities (MRFs) in Europe see similar pricing to U.S. MRFs on glass collected in single-stream systems, due to the need for secondary cleaning and sorting.

Data Corner is compiled monthly by recycling consultancy RRS.

This article originally appeared in the August 2017 issue of Resource Recycling. Subscribe today for access to all print content.

Data Corner: Balancing trade-offs as single-stream collection continues to grow

Published: October 1, 2017
Updated:

by

RRS compiled a sampling of nationwide data from Governmental Advisory Associates and U.S. EPA sources to show current average materials recovery facility (MRF) efficiency rates and community recycling rates based on MRF construction year.

Efficiency rates show the percentage of materials, by weight, that enter the MRF and are not discarded as residue.

Newer MRFs open the door for single-stream programs in which people throw all recyclables in one bin – this improves participation and boosts tonnages but affects sorting efficiency, resulting in more residuals.

The tradeoff is positive overall as long as the increase in recycling outweighs the decrease in efficiency. Developments in MRF technology to reflect the mix of materials in the stream can help to capture more, and education is essential to minimize contamination.

Data Corner is compiled monthly by recycling consultancy RRS.

This article originally appeared in the September 2017 issue of Resource Recycling. Subscribe today for access to all print content.

Data Corner: The terms used most often in outreach

Published: October 26, 2017
Updated:

by

The word cloud below represents the language utilized in 1,000 residential recycling program guidelines, as reviewed by RRS.

The size of each word is proportional to its frequency of use in program education/outreach materials.

RRS also categorized the top 100 words and found that 55 percent of those terms described an item (for example, box, bottle or container); 24 percent described materials (steel, glass, plastic, etc.); and 18 percent aimed to direct behavior (place, empty, remove, etc.).

Data Corner is compiled monthly by recycling consultancy RRS.

This article originally appeared in the October 2017 issue of Resource Recycling. Subscribe today for access to all print content.

Posted in Data Corner | Tagged |

Data Corner: The fate of plastics produced over 65 years

Published: December 1, 2017
Updated:

by

RRS utilized the data from a recent academic study, “Production, Use, and Fate of All Plastics Ever Made,” to construct a visualization of the life cycle of various plastics.

The paper, which appeared in the July edition of the journal Science Advances, determined how much virgin plastic was produced between the dawn of the plastics industry around 1950 and 2015. Researchers then estimated how much material went through different avenues.

They concluded that almost 80 percent of plastic waste generated has ended up in landfill or in our natural environment, and only 9 percent was recycled.

The study was authored by Roland Geyer of the University of California, Santa Barbara; Jenna Jambeck of the University of Georgia; and Kara Law from the Sea Education Association.


Data Corner is compiled monthly by recycling consultancy RRS.

This article originally appeared in the November 2017 issue of Resource Recycling. Subscribe today for access to all print content.

Posted in Data Corner | Tagged |

Data Corner: Chronology of the Great China Ban

Published: January 2, 2018
Updated:

by

RRS compiled a timeline of events surrounding China’s recent policy announcement that banned import of 24 types of recovered materials.

The proposal has triggered changes in commodity pricing and adjustments to several U.S. recycling programs.

This is an example of global interconnectivity in materials recovery – a foreign nation’s policy has had repercussions on virtually all facets of the U.S. recycling industry.

Data Corner is compiled monthly by recycling consultancy RRS.

This article originally appeared in the December 2017 issue of Resource Recycling. Subscribe today for access to all print content.

Posted in Data Corner | Tagged |

Data Corner: Possibilities in municipal organics

Published: January 25, 2018
Updated:

by

RRS recently worked with the Washington, D.C. Department of Public Works to research the feasibility of adding curbside compost collection to the municipality’s existing recycling program and identified several economic and environmental benefits.

High participation could be expected if carts were deployed universally, education materials were provided with the cart, and residents were given financial incentivizes to divert waste via a pay-as-you-throw or rewards program.

Data Corner is compiled monthly by recycling consultancy RRS.

This article originally appeared in the January 2018 issue of Resource Recycling. Subscribe today for access to all print content.

Posted in Data Corner | Tagged , , |