
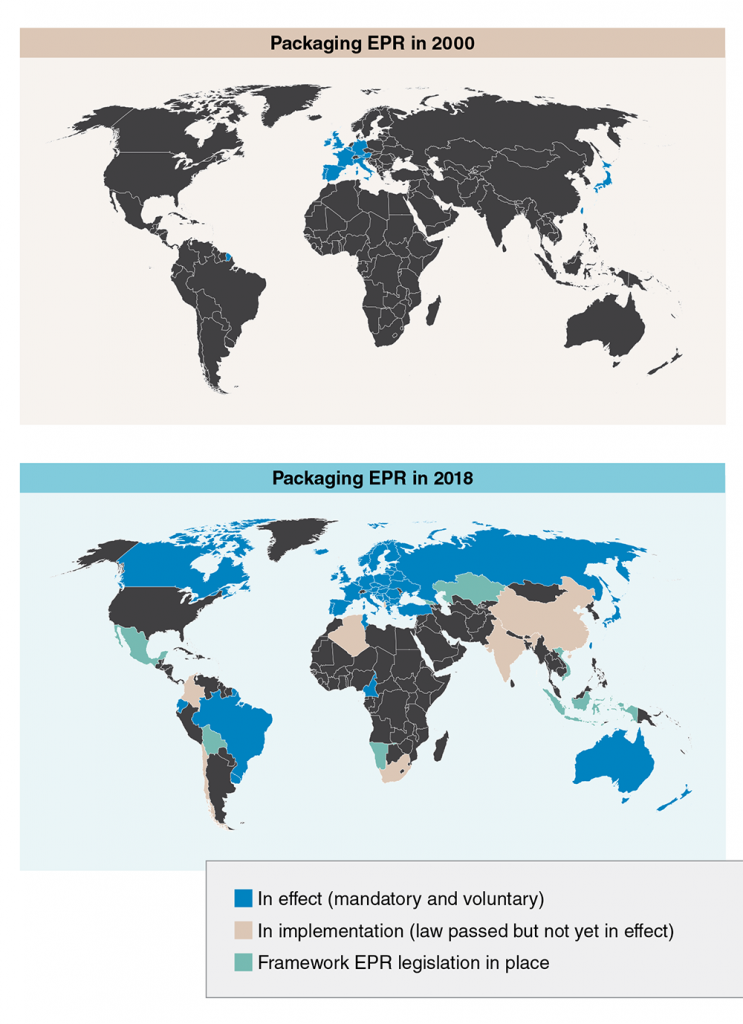
The maps below demonstrate how extended producer responsibility (EPR) programs for packaging have spread around the globe over the last decade, with programs requiring packaging makers to fund recovery systems taking root in a variety of countries.
The maps were provided by Environmental Packaging International (EPI), a consultancy specializing in environmental compliance, product stewardship and sustainability related to packaging and products. EPI, More Recycling and IHS Markit are collaborating to produce a special report exploring the impact of regulations on plastics and analyzing how well PCR supply is positioned to satisfy demand. To learn more about the project and special report, visit ihsmarkit.com/products/sea-plastics-pathway.html.
Data Sort is produced each quarter by More Recycling. For additional information, go to morerecycling.com.
This article originally appeared in the Fall 2018 issue of Plastics Recycling Update. Subscribe today for access to all print content.
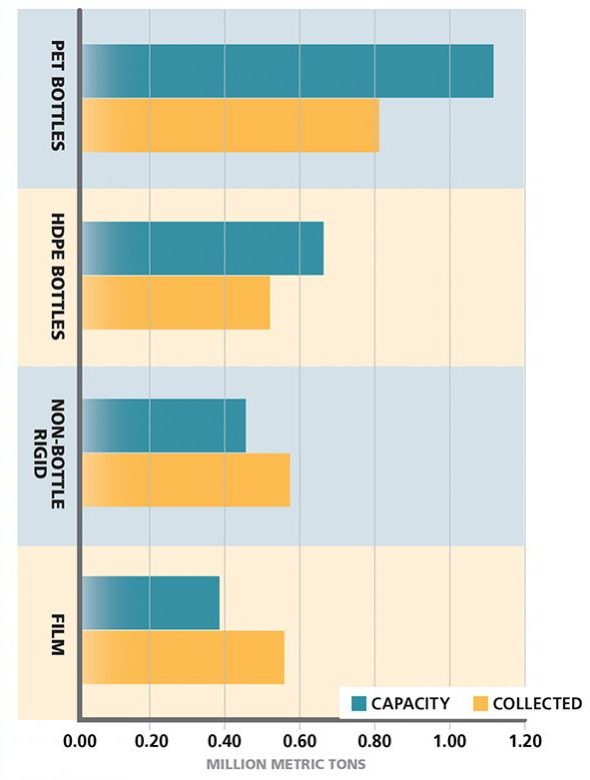
Most material that’s collected in the U.S. for recycling is reclaimed in the U.S., though there is a supply/demand imbalance for some commodities.
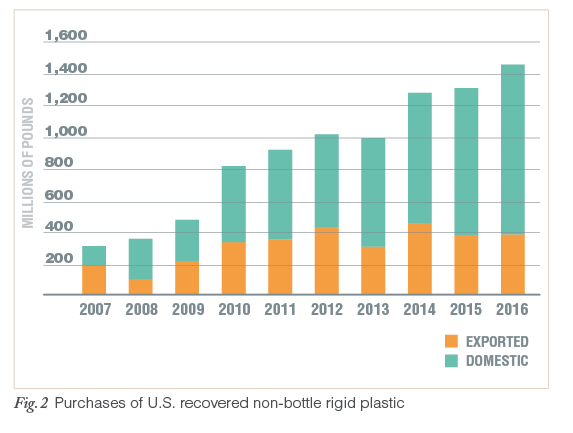
This imbalance has traditionally been remedied through demand from the export market, but the amount of material going to export has trended downwards since 2009 and will likely continue to decrease going forward, especially in light of recent policies in China reducing imports.
We have seen a growth in domestic reclamation capacity, but we need more demand and processing capabilities for materials such as film and non-bottle rigid plastics.
This article originally appeared in the May 2017 issue of Plastics Recycling Update. Subscribe today for access to all print content.
Data Sort is produced each quarter by More Recycling. For additional info, go to morerecycling.com
The North American plastics recycling industry is facing uncertainties in terms of the future of export markets as China and other importers evolve policies.
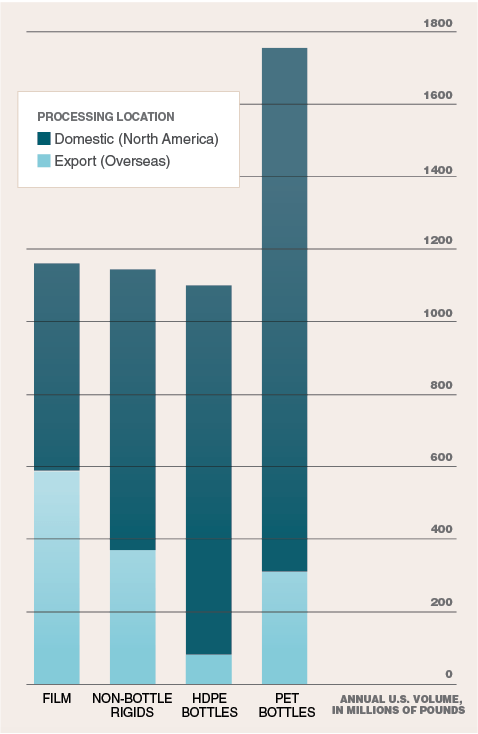
Some plastics sectors feel the effects of these developments more than others. According to the most recent research, roughly 28 percent of recycled plastic collected in the U.S. heads to export markets.
The graph below shows how four key plastic types fit into the export total. Film and non-bottle rigids rely the most on foreign buyers – so these are the materials most likely to be significantly impacted by export undulations.
This article originally appeared in the August 2017 issue of Plastics Recycling Update. Subscribe today for access to all print content.
Data Sort is produced each quarter by More Recycling. For additional info, go to morerecycling.com
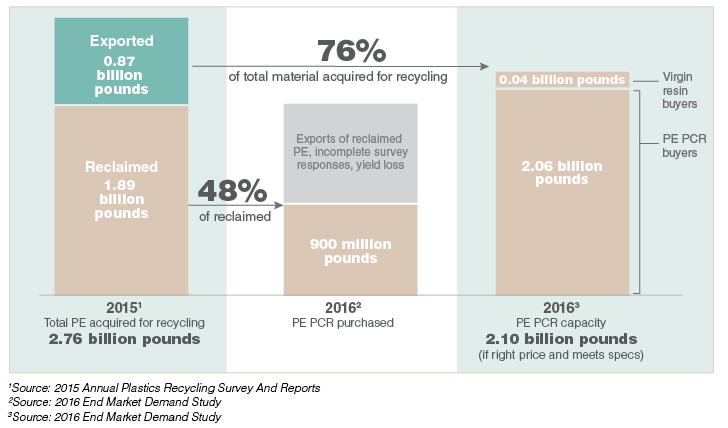
According to the most recent statistics, around 900 million pounds of polyethylene post-consumer resin (PCR) are purchased annually in the U.S. for use in new products, but 2.76 billion pounds of PE are collected for recycling.
That means collection is exceeding domestic demand by 1.86 billion pounds. However, information from buyers indicates they could use more if the PCR hits price and specification requirements – these buyers have a potential annual capacity of 2.10 billion pounds, or 76 percent of what is currently collected.
Even with the narrowing of that delta due to yield loss in the reclamation process, demand for recycled content will need to continue to increase to match collection totals.
This article originally appeared in the November 2017 issue of Plastics Recycling Update. Subscribe today for access to all print content.
Data Sort is produced each quarter by More Recycling. For additional info, go to morerecycling.com
The largest environmental benefit from plastics recycling comes when post-consumer resin (PCR) is incorporated into a new product, displacing virgin resin that would otherwise be used. To bring that somewhat abstract concept into real-world terms, we analyzed the effects of increasing PCR in one specific everyday item: plastic trash bags.
In the U.S. trash bag market, approximately 6 billion pounds of PE resin is used annually. The table below shows the details on what would happen if different levels of PCR usage were achieved in the production of these products. Note that 10 percent PCR is currently required in trash bags sold in California and one company, Revolution Bag, currently has a product line featuring 97 percent PCR.
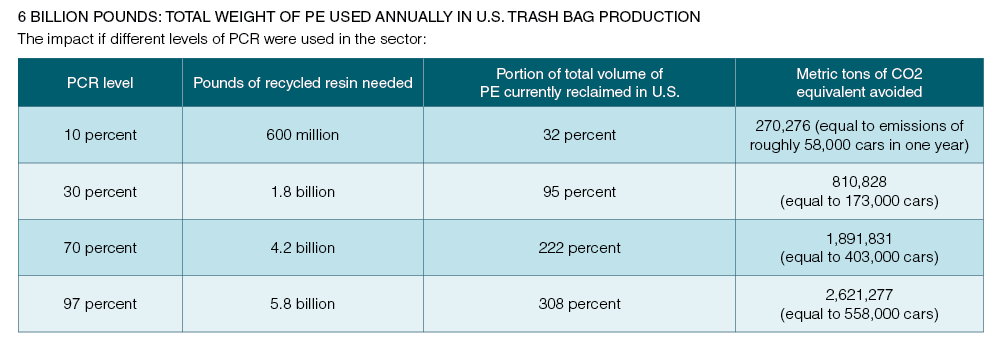
Numbers were tabulated by More Recycling using information from several private reports as well as the U.S. EPA’s WARM calculator and extrapolation of California’s most recent waste characterization study.
Data Sort is produced each quarter by More Recycling. For additional information, go to morerecycling.com.
This article originally appeared in the February 2018 issue of Plastics Recycling Update. Subscribe today for access to all print content.
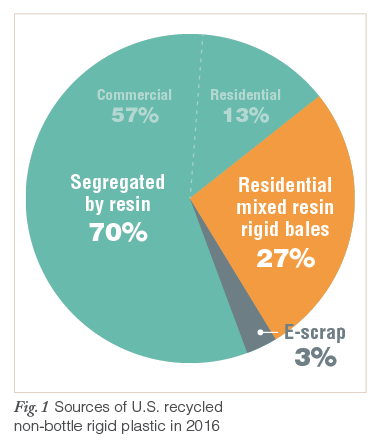
The graphs below show findings from the “2016 National Post-Consumer Non-Bottle Rigid Plastic Recycling Report,” which was released earlier this year. U.S. and Canadian buyers reported a marginal increase in non-bottle rigid plastic acquired from purchasing of mixed-resin rigid bales, with most of their overall increase coming from the purchasing of non-bottle rigid plastic segregated by resin from both residential and commercial sources.
As China’s import policies continue to affect the market, material that is not segregated by resin is the most at risk because there is less demand from the export market and little sorting capacity and infrastructure in the U.S. to get that material to reclaimers and end markets. This non-segregated portion currently makes up 27 percent of the non-bottle rigid plastic collected for recycling in the U.S.
For complete details on the non-bottle rigid report, go to stina.biz/nonbottle17.
Data Sort is produced each quarter by More Recycling. For additional information, go to morerecycling.com.
This article originally appeared in the Spring 2018 issue of Plastics Recycling Update. Subscribe today for access to all print content.
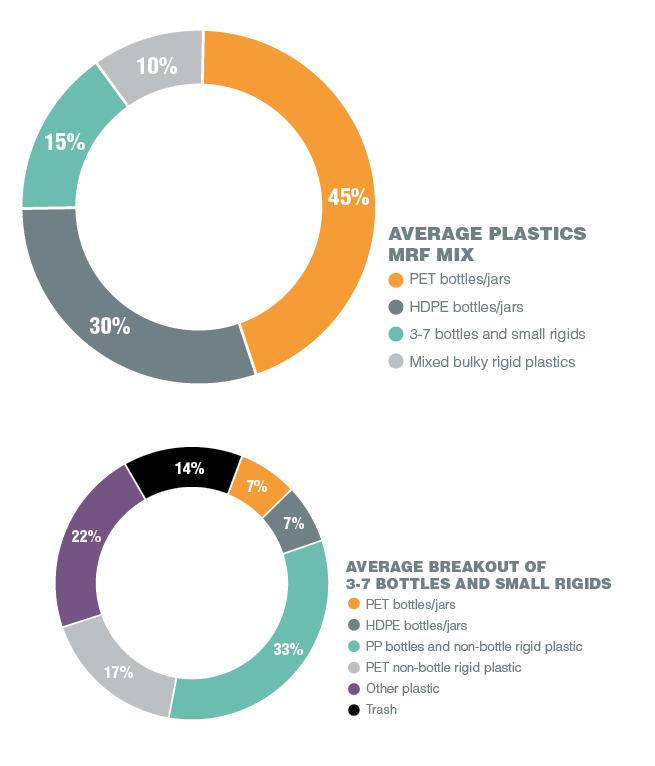
Most West Coast materials recovery facilities (MRFs) are not equipped to sort plastics beyond PET and HDPE bottles. This material is often referred to as 3-7, but it includes small rigid plastic of all resins, as well as missed PET and HDPE bottles. It is this mix that is struggling to find a market in the wake of National Sword. Though the 3-7 bottle and small rigid category makes up just 15 percent of all plastics collected, it carries significant economic implications.
Polypropylene (PP) is the largest component of these bales. Taking California as the West Coast example, not recycling PP translates to at least $4 million in lost revenue (based on current scrap pricing), about $2 million in incurred landfill costs, and lost CO2 reduction savings equivalent to the emissions of nearly 5,000 cars on the road every year.
The charts below are estimates based on More Recycling’s expertise and industry knowledge and from data that’s been compiled from a variety of industry studies supported by the Association of Plastic Recyclers (APR) and the American Chemistry Council (ACC), among other organizations. Check out other key data sets and tools supported by APR and ACC at PlasticsMarkets.org and RecycleMorePlastics.org.
 Data Sort is produced each quarter by More Recycling. For additional information, go to morerecycling.com.
This article originally appeared in the Summer 2018 issue of Plastics Recycling Update. Subscribe today for access to all print content.
