The decline in U.S. scrap plastic exports accelerated for the second year in a row, according to recently released U.S. Census Bureau trade data.
The bureau recently published trade data for December, allowing Plastics Recycling Update to analyze the full-year 2022 data and compare it with prior years.
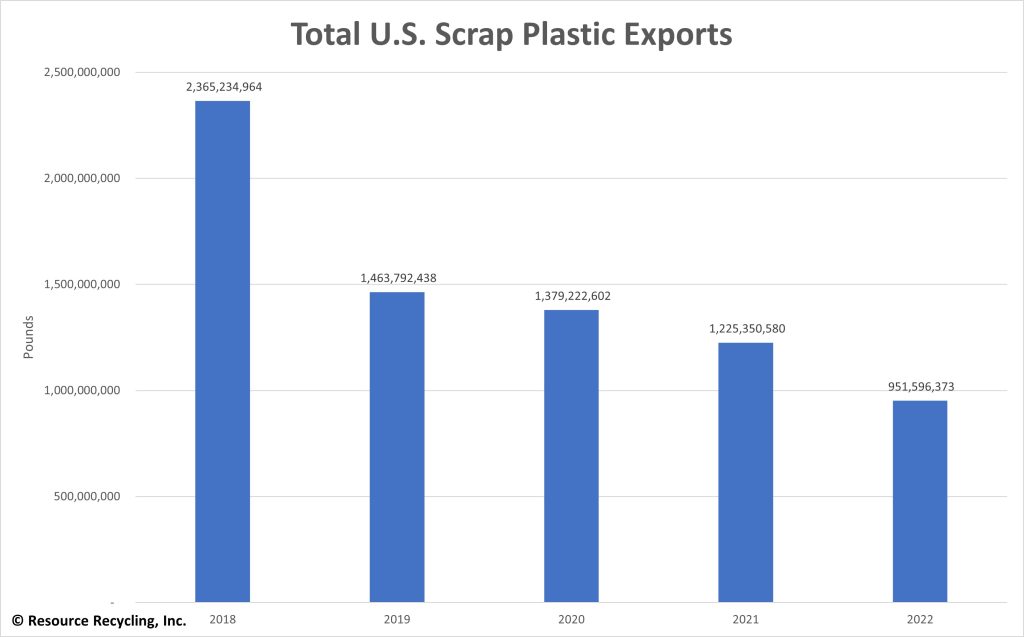
The data shows U.S. shipments of recovered plastic to foreign destinations totaled 952 million pounds in 2022, down 22% from the prior year. The 2021 export number was down 11% from 2020, which was down 6% from 2019.
Exports have been falling ever since China’s National Sword campaign began in earnest at the beginning of 2018. In 2017, shipments totaled about 3.68 billion pounds. They plummeted to 2.37 billion pounds in 2018, 1.46 billion pounds in 2019, 1.38 billion pounds in 2020 and 1.23 billion pounds in 2021.
The following chart shows total U.S. scrap plastic exports over the past five years (story continues below chart):
On a country-by-country basis, last year brought some significant swings in weights. For example, exports to Vietnam and Malaysia dropped 61% and 57%, respectively, but shipments to Germany and Pakistan increased 58% and 38%.
The following were the top 10 destinations for U.S. scrap plastics: Canada received 316 million pounds (down 16%), Mexico 186 million pounds (up 1%), India 97 million pounds (up 5%), Malaysia 78 million pounds (down 57%), Indonesia 45 million pounds (down 26%), Vietnam 31 million pounds (down 61%), Germany 28 million pounds (up 58%), Turkey 24 million pounds (down 21%), El Salvador 22 million pounds (down 24%) and Pakistan 14 million pounds (up 38%). The rest of the world took in a total of 110 million pounds (down 33%).
The following chart shows the changes (story continues below chart):
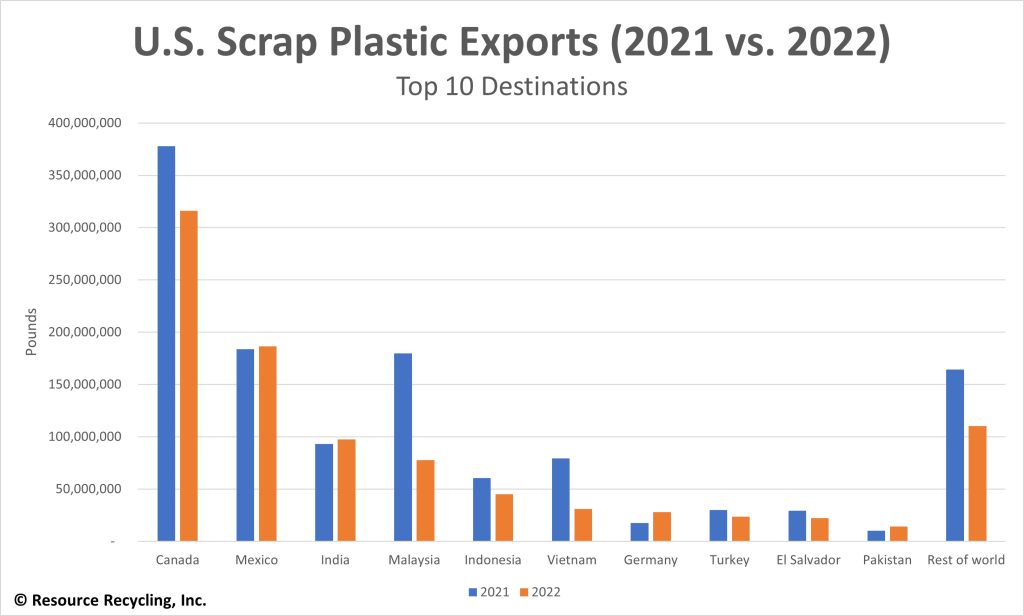
The top 10 list changed from 2021 to 2022. Hong Kong and Taiwan fell off the list, and Germany and Pakistan climbed onto it.


