


Scrap plastic exported out of the U.S. is moving to Southeast Asia, where reclaimers are dramatically increasing purchases as China closes its doors to recovered materials. New figures illustrate that shift.
Malaysia nearly quadrupled its U.S.-sourced imports of plastics categorized as mixed/other last year, jumping from about 9,600 metric tons in 2016 to nearly 38,000 a year later, according to figures from the Institute of Scrap Recycling Industries (ISRI). It also brought in substantially more PE and PET, as did Thailand and Vietnam. India, meanwhile, absorbed major tonnages of PE last year, increasing imports 50 percent to reach more than 88,000 metric tons, larger volume growth than that of any other country.
Figures on the shifting market come as China continues to take steps barring scrap from entering its borders. The first round of 2018 import permits shows a stunning drop in plastic tonnages and companies approved for import compared with a year earlier. Also, Chinese officials last week finalized a 0.5 percent contamination limit for recovered plastic imports.
In the past, China has been responsible for 51 percent of scrap plastic imports, according to data from ISRI. But with the country’s much-discussed imports ban, reduced import permits and upcoming contamination crackdown, that has changed dramatically.
The Chinese policy changes have quickly begun to “reshape the global recycling landscape,” ISRI Chief Economist Joe Pickard said, and newly compiled data from the industry group makes that market movement clearly visible.
Countries up plastics demand
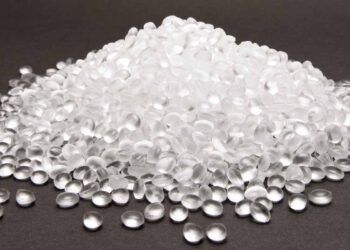
Plastics exporters have begun shipping bales to Southeast Asian processors who will create pellets that can be sent to Chinese end users, according to the China Scrap Plastics Association (CSPA).
Plastic has seen the largest movement into other countries over the past year.
“It’s a real game changer that (China is) not going to be taking this in,” said Bernie Lee, ISRI’s commodities research analyst. The global industry has already begun to adapt. Lee pointed to several large plastic scrap growth markets broken down by resin.
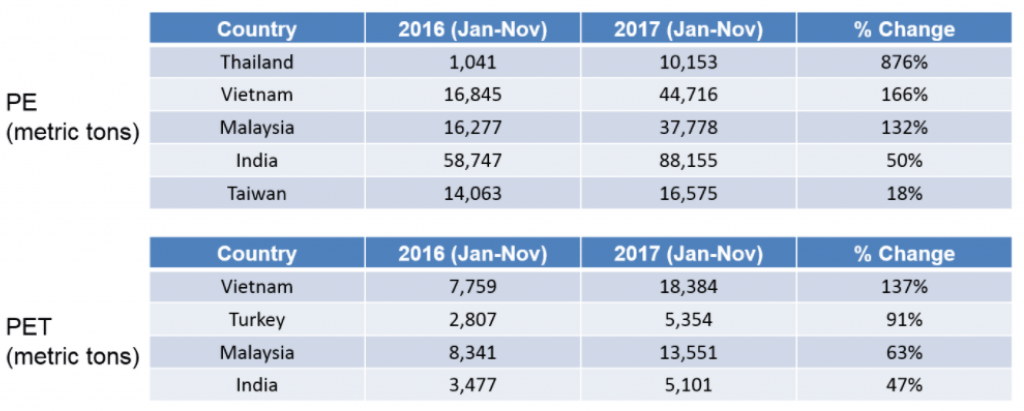
For PE, India has had the most volume growth, importing 88,155 metric tons in 2017 compared with 58,747 a year earlier, according to the figures from ISRI. Vietnam increased PE imports by 166 percent, from 16,845 to 44,716 metric tons. Malaysian imports grew 132 percent, from 16,277 to 37,778 metric tons. Taiwan increased imports by 18 percent, from 14,063 to 16,575 metric tons. Thailand increased PE imports by 876 percent, but the volume was relatively small: 10,153 metric tons, up from 1,041.
Recovered PET shipments saw similar Southeast Asian growth on a smaller volume level. Turkey also nearly doubled PET imports, although that was only an increase of about 2,500 metric tons.
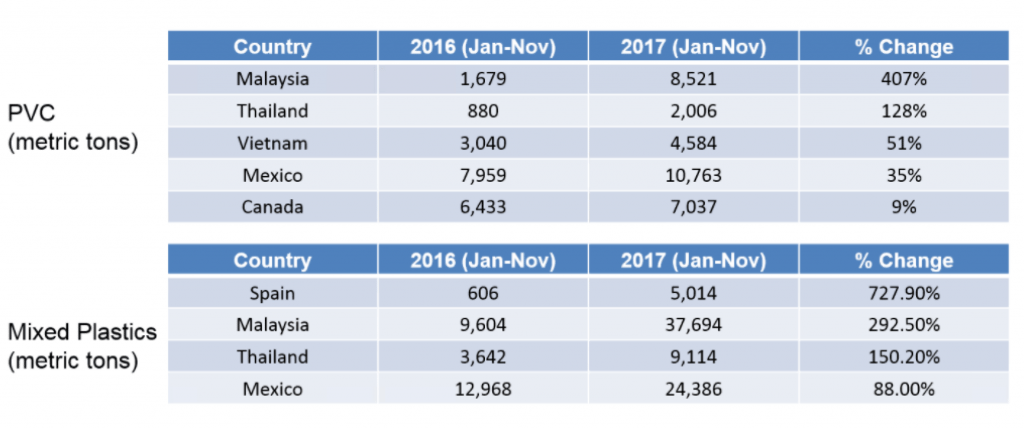
For PVC, Malaysia grew imports by 407 percent to hit 8,521 metric tons in 2017. Canada, Mexico, Thailand and Vietnam also saw modest increases by smaller volumes.
The mixed/other category of plastics saw large volume growth in Malaysia, where imports grew from 9,604 metric tons in 2016 to 37,694 the following year. Mexico increased imports from 12,968 to 24,386 metric tons. Thailand increased imports from 3,642 to 9,114 metric tons. Spain also boosted imports from 606 to 5,014 metric tons last year.
Although these provide a clear picture of where material is migrating, Lee cautioned against drawing too much from the numbers, particularly given the fast-changing market dynamics where exporters are scrambling to find outlets for material.
“A large growth change doesn’t necessarily mean that there’s a huge amount of consumption demand that’s going to be coming on-line in the next few months or next few years,” he said. “It really depends on what may have been available at the time.”