






This article appeared in the Spring 2021 issue of Resource Recycling. Subscribe today for access to all print content.
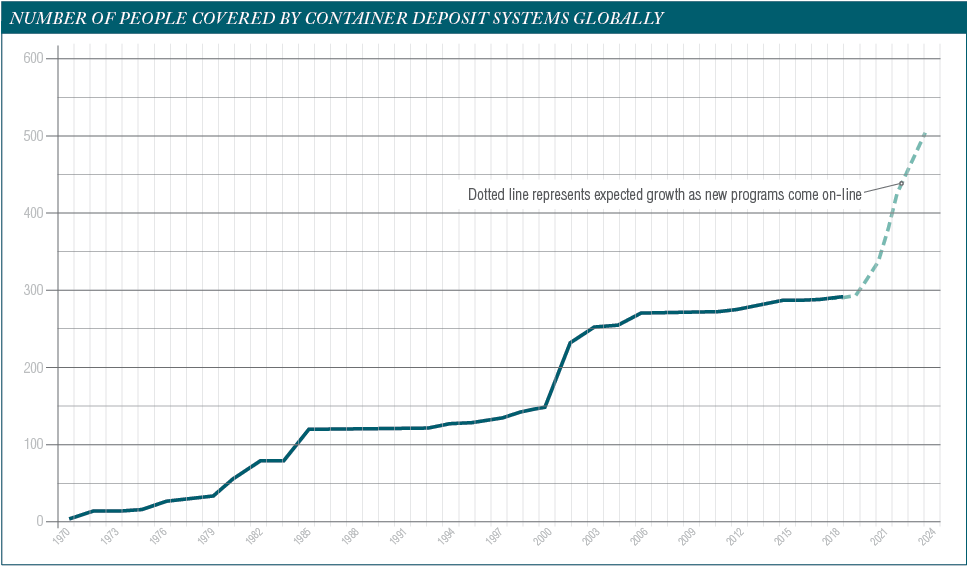
In 1970, the province of British Columbia became the first jurisdiction in the world to implement a mandatory deposit return system for single-use beverage containers. Fast-forward 50 years and over 40 jurisdictions have established a deposit system, including most parts of Canada and Australia, 10 European countries, 10 U.S. states, Israel, and parts of the Caribbean. As a result of these initiatives, over 290 million people worldwide now have access to container deposits, and the number continues to grow.
Over the last two to three years, governments around the world have announced they too will soon implement deposit systems. Programs are expected in England, Scotland, Northern Ireland and Wales. In Australia, plans are in place for the states of Tasmania and Victoria. Action is also underway in Jamaica, Latvia, Malta, New Zealand, Portugal, Romania, Singapore, Slovakia and Turkey.
Most recently, in September 2020, Austria’s environment minister announced plans for a deposit on plastic beverage bottles and metal cans, although specific details such as implementation date are still being worked out.
By the time all these programs are implemented, it’s estimated that nearly 500 million people will have access to deposit return systems. This is double the number covered just 15 years ago.
In 2016 Reloop released “Deposit Systems for One-Way Beverage Containers: Global Overview,” the first-of-its kind global report on deposits. At the end of 2020, the third edition of the report was released. This updated data can help government officials and those in the beverage industry and recycling sectors seeking to understand how these systems are structured. The report offers insights on how container redemption systems are financed in different jurisdictions and what recovery levels they can achieve depending on how they are designed.
 How well do systems perform?
When it comes to single-use beverage containers, numbers from across the globe consistently show that recycling rates are significantly higher in jurisdictions that have implemented deposit frameworks.
Our research shows that European countries with deposit return systems achieve the highest return rates, ranging from a low of 87% in Estonia to a high of 98% in Germany. In Canada, the average return rate for deposit provinces is 80%. This can be compared to the performance of Ontario’s curbside program, which recovers just 46% of non-alcohol beverage containers.
In some provinces, including Alberta, Prince Edward Island and the Northwest Territories, recycling rates are significantly higher, extending beyond 85%. The average return rate for U.S. states with deposit systems is much lower, at around 69%. At 67%, the average return rate for Australian states is similarly low, though this can be explained by the fact that two programs in that country are fairly new, having been implemented only in 2018.
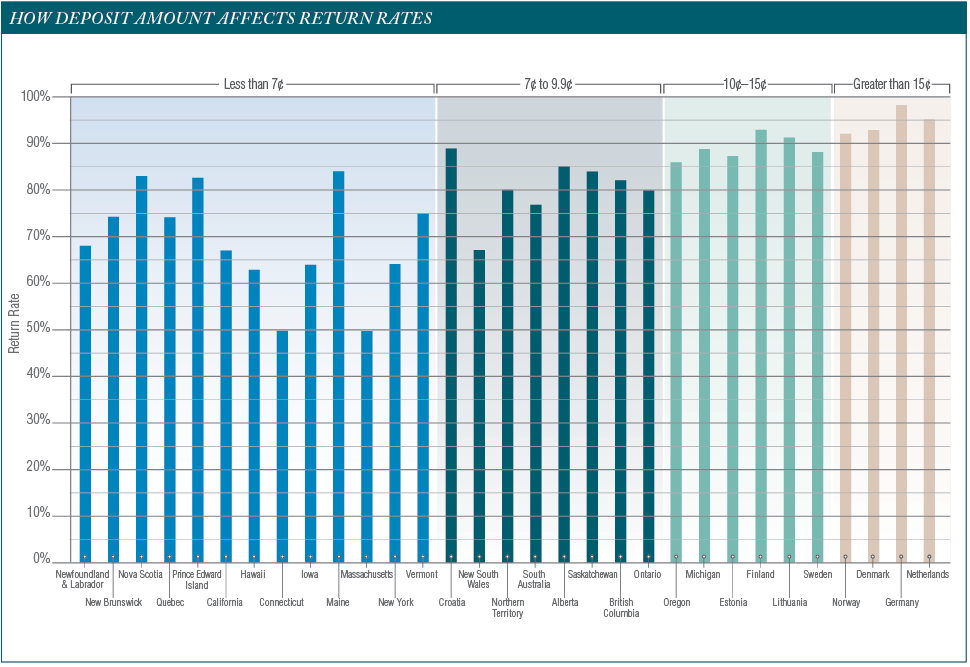
Although return rates can be influenced by several factors, there is strong evidence to suggest that the size of the deposit matters, and that higher deposit/refund values tend to produce higher return rates. Our research found that the average return rate in jurisdictions with a minimum deposit of less than 7 U.S. cents was just 69%. This increased to 80% for programs that charged a minimum deposit of between 7 and 9.9 cents, and to 88% in places with a minimum deposit of between 10 and 15 cents. The highest average return rate (95%) is seen in jurisdictions with a minimum deposit level that’s equivalent to 15 U.S. cents or more – all of these programs are in Europe.
 Convenience consideration
Besides the deposit value, the convenience of container return is another key factor in the success of a deposit system. There are a handful of strategies in this realm, including:
- Return-to-retail: This model allows consumers to return their containers while doing their shopping, avoiding additional trips out of the home and expensive system-specific infrastructure.
- Return-to-redemption center (depot): This model allows consumers to return empty containers for recycling to facilities established solely for this purpose.
- Hybrid model (redemption centers alongside retail stores): These frameworks may allow retailers to opt out if they are in a “convenience zone” – that is, within a specified distance of a redemption center.
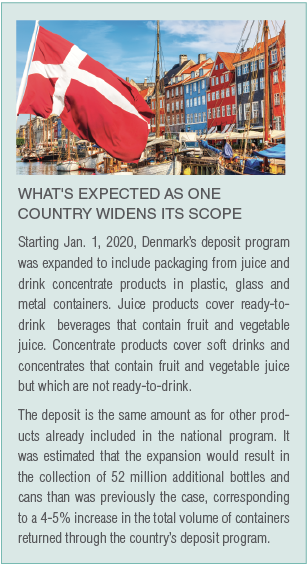 The highest return rates can be seen in systems that use a return-to-retail approach, where retailers selling beverages become legally responsible for accepting empty containers for recycling. This model is considered best-in-class as it is the most convenient for consumers and also offers benefits for retailers (increased foot traffic, economic incentives and an improved corporate image).
Return-to-retail models are most common in Europe, whereas return-to-redemption center models are more prevalent in the rest of the world. Our research found that the median return rate in programs that utilize a return-to-retail model was 90%, compared with 76% in programs that use a return-to-redemption center or hybrid model.
The performance of a deposit program is also dependent on program scope – in other words, the types of beverage containers it covers. In general, the wider the scope, the more effective the program will be. Eligible containers are typically defined by what beverage they contain (typical categories include alcoholic, non-alcoholic, carbonated and non-carbonated) or what material the container is made from (plastic, aluminum, glass, polycoat, etc.).
The majority of deposit systems include plastic, metal and glass containers, although some of them only cover certain material types. In Norway and Sweden, for example, glass is excluded, and in the Netherlands, glass and metal are excluded. Aside from increasing overall return rates, expanding the scope of the system has the added advantage of making it fairer for competing material types. It also levels the playing field for competing brands and makes it simpler for the consumer to understand what can be redeemed.
Who’s running the show?
Whether or not a deposit system includes a central system operator is yet another factor that can impact program performance.
A centralized clearing system – where one organization organizes the logistics and provides a clearinghouse by managing all data, finances and compliance – is considered best-in-class as it helps to ensure transparency in respect to units placed on the market. This approach also helps bring consistency to redemption levels and, most importantly, makes it clear who is covering the costs of the system.
Centralized systems also help to ensure that logistics are optimized, avoiding duplication of activities that could increase producers’ costs and workload.
However, most U.S. states that use a deposit system operate a decentralized model, in which there is no central coordination of data. Beverage producers are directly responsible for administering the system, including collection their own containers and ensuring payment accounts are reconciled.
In contrast, all of Canada’s provinces/territories operate a centralized framework, as do most European countries. In fact, Germany is the only European deposit program that is decentralized.
 The solution for higher targets
As deposit systems continue to become more widespread, it’s more important than ever for industry, government agencies, and other stakeholders to understand how these programs work.
As of 2020, over 40 jurisdictions have implemented deposits as a tool to recover single-use beverage containers for high-quality recycling. And thanks to the European Union’s Single-Use Plastics Directive (SUPD), which was adopted in June 2019, deposits will likely expand to even more countries in Europe over the next decade. Under the new law, member states are required to achieve a 77% collection target for plastic beverage bottles by 2025, increasing to 90% by 2029.
Since achieving recycling rates of over 90% for beverage containers is virtually impossible using any other collection method, the 90% target practically implies that governments will have to implement container deposits.
Leaders in those EU countries – and everywhere else – would be wise to look at the data on systems to understand the specific components that lead to the highest levels of container return.
Samantha Millette is research and analysis coordinator for Reloop Platform, an international nonprofit organization that works on circular economy initiatives. Millette can be contacted at samantha.millette@reloopplatform.org.
Jason Wilcox is an analyst with Reloop as well as project manager with CM Consulting. He can be contacted at jason.wilcox@reloopplatform.org.