
Purification and depolymerization and conversion, oh, my! We look into these technologies and their role in plastics recovery. | Rost9/Shutterstock
This article appeared in the Spring 2025 issue of Plastics Recycling Update. Subscribe today for access to all print content.
Chemical recycling, the umbrella term for a wide array of processes that break down the molecular chains of plastic polymers, has been a contentious topic for years, drawing debate over its role, how to regulate it and where it fits into the larger picture of resource circularity.
But even stakeholders on opposite sides of the debate found common ground in recent interviews, sharing concerns that the technology has been overpromised on one hand as well as ideas for how it can complement, rather than replace, conventional mechanical recycling on the other.
“We now have routinely seen facilities operating at reduced capacity, delays getting online, things like that,” said Anja Brandon, director of plastics policy at the Ocean Conservancy, a Washington, D.C.-based nonprofit that doesn’t support chemical recycling. Brandon cited the April 2024 closure of Agylix’s joint PS recycling venture, Regenyx, in Oregon, among other facility closures and disruptions, as evidence that the technologies aren’t the “get-out-of-jail-free card they were promised to be.”
“I think the false promises that were made of ‘we can accept all of your plastics, and it’s really cost-efficient, and you’ll get plastics back immediately’ — folks are starting to see through those lies, and because of that, some of the smart chemical recycling companies are now changing their language,” Brandon said. Now she’s hearing chemical recycling advertised as “just a part of the puzzle.”
Brian Bauer, CEO of California-based chemical recycling company Resynergi, agreed that early claims that pyrolysis could handle anything weren’t helpful. The company uses microwave energy to break down HDPE, LDPE, PP and PS and announced in February that it had raised $18 million toward commissioning its first commercial-scale chemical recycling plant.
“Some players said, ‘We can take everything,’ and it’s like — come on, guys,” Bauer said, adding that the industry needs to show people that chemical recycling works.
“Otherwise they’re feeling lied to,” he said. “We’re not making the claim we’re going to do all plastic for everyone. We’re doing our part.”
Brandon and others also agreed that chemical recycling could play a beneficial role in managing end-of-life plastics, though Brandon said that role is limited and even shrinking, while industry players took a much more ambitious view.
“A robust chemical recycling industry is essential to achieve significantly greater recycling rate targets, such as the Environmental Protection Agency’s 50% by 2030 National Recycling Goal,” Ross Eisenberg, president of American Chemistry Council’s plastics division, wrote in an email. “While mechanical recycling should be prioritized for the plastics it is suited to recycle, chemical recycling is needed for the many types of plastics that can’t enter the mechanical recycling stream.”
Ins and outs of chemical recycling
Chemical recycling includes processes that use heat, pressure and solvents to break polymers into liquids or gasses that can then be processed into fuels, oils, waxes, new plastics or other chemical products. It’s also commonly referred to as advanced recycling, non-mechanical recycling and molecular recycling.
Whatever the term, it’s typically used to describe three main technologies: purification, depolymerization and conversion.
Purification covers technologies that use solvents to dissolve plastic and separate it out from additives. The plastic can be recovered without changing the basic molecular structure, but the process requires highly pure feed stocks and can only be used for certain types of plastic. It’s a newer technology that isn’t yet available at scale.
Depolymerization is a broad category that uses solvents, heat, catalysts or a combination thereof. It also requires pure feed stocks and is also limited to very specific types of plastics called condensation polymers, such as nylon and PET. Methanolysis, which utilizes methanol, is one of the most common types, but the technology is also newer. Enzymatic depolymerization, which uses bacteria, fungi or other microorganisms, has also been studied but is not at scale.
Conversion technology in general has been around for decades for turning plastic into fuel. Two types of technologies are widespread today: pyrolysis and gasification. Pyrolysis uses high heat and pressure to break apart chemical bonds in plastic to create what’s called pyrolysis oil, which can be used as fuel, to create new plastic and in other applications. Gasification uses heat and pressure to break chemical bonds to produce mainly synthetic natural gas.
A 2023 Closed Loop Partners study evaluated several technological processes in terms of environmental impacts and financial viability of several types of chemical recycling technologies. In terms of total packaging volumes accepted across the United States and Canada, the study found that conversion techniques could accept 82% of all plastic packaging produced — more than mechanical, purification or depolymerization technologies could alone.
However, the researchers noted that when looking at the amount of PCR each category can yield, conversion technologies “have the longest route back to becoming plastic.” They estimated that purification would yield the highest volume of PCR, while conversion yielded the lowest amount, about half as much.
Typical yields of usable, specifically plastic material from conversion technologies range from 0.1-5.7% for pyrolysis to 2-14% for gasification, according to the Ocean Conservancy, because many of the end products have non-plastic uses. Typical yields of mechanical recycling, meanwhile, range from 73-84%.
Through an environmental lens, purification and depolymerization technologies had smaller environmental footprints on average, the report found, taking into account energy use, greenhouse gas emissions and water impacts.
A lifecycle analysis from the U.S. Department of Energy’s Argonne National Laboratory and supported by the American Chemistry Council suggested that chemically recycling plastics entails lower greenhouse gas emissions than virgin production but didn’t compare it to mechanical recycling.
Another study conducted by the National Renewable Energy Laboratory did make that comparison and found mechanical recycling and glycolysis, a type of depolymerization, outperformed all other technologies in a variety of metrics.
A growing industry
Many chemical recycling companies have started up over the past five years, with some taking hold and others folding. Companies like Cyclyx, Brightmark and PureCycle have built or are in the process of building more than 1 billion pounds of processing capacity in the U.S. and other countries. There are also some oil heavyweights in the ring, such as ExxonMobil, and chemical companies such as Eastman.
Eastman, for example, started a chemical recycling facility in Kingsport, Tennessee, in late 2023 and is now close to running at 100% capacity. The plant uses methanolysis to process scrap PET into resin, branded as Tritan Renew. It includes food-grade PET resin with up to 75% recycled dimethyl terephthalate, or DMT, one of the chemicals produced by the methanolysis process.
The feedstock is largely opaque and colored packaging, which comes from sources including a supply agreement with Midwest recycling operator Rumpke. In 2024, the company announced plans to build a second facility in Longview, Texas, and the U.S. Department of Energy granted the project up to $375 million. It also has plans for a facility in France. Eastman uses two different technologies: carbon renewal technology, which employs a form of gasification, and polyester renewal with methanolysis.
ExxonMobil has been building a large chemical recycling footprint based on its pyrolysis technology as well. In November, it announced 350 million additional pounds of capacity in Texas, slated to come online in 2026. That’s in addition to a 150-million-pound unit that started up in December 2022 and a second unit announced in May at the large Baytown site in Texas, expected to start up in 2025.
That puts the company’s total U.S. plastic processing capacity at 500 million pounds per year by 2026, spread over a total of six units. The Baytown site is currently the only operational chemical recycling plant, and it has processed more than 70 million pounds of plastic scrap.
ExxonMobil is also developing chemical recycling projects elsewhere in North America, and in Europe and Asia, with a goal of 1 billion pounds of annual recycling capacity globally by 2027.
Joshua Dill, a plastics recycling analyst at ICIS, said one marker of success for chemical recycling is “the fact that it’s still alive, especially now, considering interest rates are staying at relatively elevated levels.
“Chemical recycling investment is quite high, especially relative to mechanical,” he said. “That initial capex is quite substantial.”
And while more than 70% of announced plants have not yet made a final investment decision, Dill noted that projects are still being announced and garnering investment.
A mixed reception
California’s attorney general last fall filed a lawsuit against ExxonMobil, alleging its claims about plastic recyclability have been misleading and deceitful. The company responded with its own lawsuit for defamation in January.
The dispute encapsulates a larger back-and-forth over the nature of chemical recycling that’s playing out across the U.S. and beyond.
The states have differed over whether chemical recycling facilities should be considered recycling or waste disposal, which brings tighter environmental regulations, or be treated as manufacturing, which enjoys looser rules. More than half have passed bills taking the more lenient route.
“Policymakers all across the country – in their communities and in their states – want to see greater amounts and more types of plastics recycled,” Craig Cookson, then senior director of plastics sustainability at the American Chemistry Council, said in 2023.
Other states, such as Maine, have passed laws clarifying that chemical recycling should be regulated as waste management, even if materials handled by the process don’t count toward state recycling goals. Oregon allows for the possibility of chemical recycling technology but places preference on mechanical recycling over both landfill and chemical recycling. The state’s packaging EPR law states that all material has to be responsibly managed by a facility that is transparent and environmentally sound.
Some organizations also make a distinction between plastic-to-plastic chemical recycling and plastic-to-fuel. The Recycled Materials Association, for example, supports processes that convert used plastic into resins and monomers but doesn’t support turning it into petrochemical products for energy.
In addition, “ReMA does not support the label of ‘advanced recycling’ for non-mech-
anical recycling, as doing so creates a totally inappropriate and untruthful distinction between mechanical and non-mechanical recycling processes,” according to the group’s position statement.
At the federal level, a bipartisan bill that would, among other things, set a minimum post-consumer content rate for plastics and explicitly include chemical recycling has drawn support from the plastics industry. Eisenberg with ACC said it could position the U.S. as “the world leader in plastic manufacturing and recycling.”
“Chemical recycling facilities require significant capital expenditure to build, often hundreds of millions of dollars,” he said. “For companies to make such a large investment, they need both regulatory and market certainty that their investments will be economically viable long term.”
On the global stage, Brandon said the world has continued to deadlock on the topic in discussions on international agreements, often simply leaving the question unresolved.
For example, during the 2023 Basel Convention meetings, she remembers working on the technical guidance of environmentally sound management of plastic. Chemical recycling ended up being included in brackets in the technical guidelines and appendix, which she called “international legal code for ‘we don’t know, and we can’t agree.'”
Brandon said she thinks more transparency would be helpful — as would using more specific terms for the very different technologies and outcomes that fall under the umbrella of chemical recycling.
“Painting things with a broad brushstroke really does a disservice to decision makers who are really trying to grapple with implementation or passing laws,” she said.
An EPR niche?
Bauer said Resynergi recently finished a two-year pilot, has shipped its first containers of oil to several customers and is building its first commercial-scale site, in California, with plans to expand to several more sites in the area later.
He’s focused on California due to the extended producer responsibility legislation there, he said.
“I really think we fit the spirit of SB 54 so, so well,” he said, because the EPR law talks about reducing carbon footprints and being “safe and friendly to local communities.”
“Any site will bring 30 jobs and a very small footprint. Our emissions are equivalent to approximately a semitruck driving down the road,” he said. “Our VOCs are like a passenger car when we are doing 20 tons per day. Other approaches are doing 200 tons per day, but we’re decentralized and co-located with smaller MRFs.”
Bauer added that SB 54 also calls out the need to avoid creating hazardous waste, and in his view, “with pyrolysis, when you do it well and right, everything is a product. There’s essentially zero waste, no hazardous waste.”
Alterra, a chemical recycling company with a plant in Akron, Ohio, that has been operating since 2013, also highlighted how chemical recycling could support EPR by bringing less commonly recycled materials, such as multi-layer packaging and contaminated plastics, into the system.
“One of the greatest strengths of chemical recycling lies in its diversity. No single technology can process all types of discarded plastics, but collectively, chemical recycling solutions can address a wide range of materials that would otherwise go to landfill or incineration,” the company said in a written statement.
“Ultimately, EPR will only be successful if robust end markets exist for recycled materials. Chemical recycling unlocks endless end-market demand by supplying high-quality recycled feedstocks to industries that require strict material performance, such as packaging, automotive, and consumer goods.”
On the other hand, Brandon with the Ocean Conservancy argued that, as comprehensive management policies such as EPR emerge, “the part of the problem they could solve for is shrinking.” She pointed to the need for high-quality bales in particular.
“At the point at which you get a grade A bale, you can send it to mechanical recycling,” she said. “It kind of poses the question: What problems are we truly solving with this kind of technology, especially in the context of packaging, where mechanical recycling is one of the most cost efficient and sustainable solutions?”
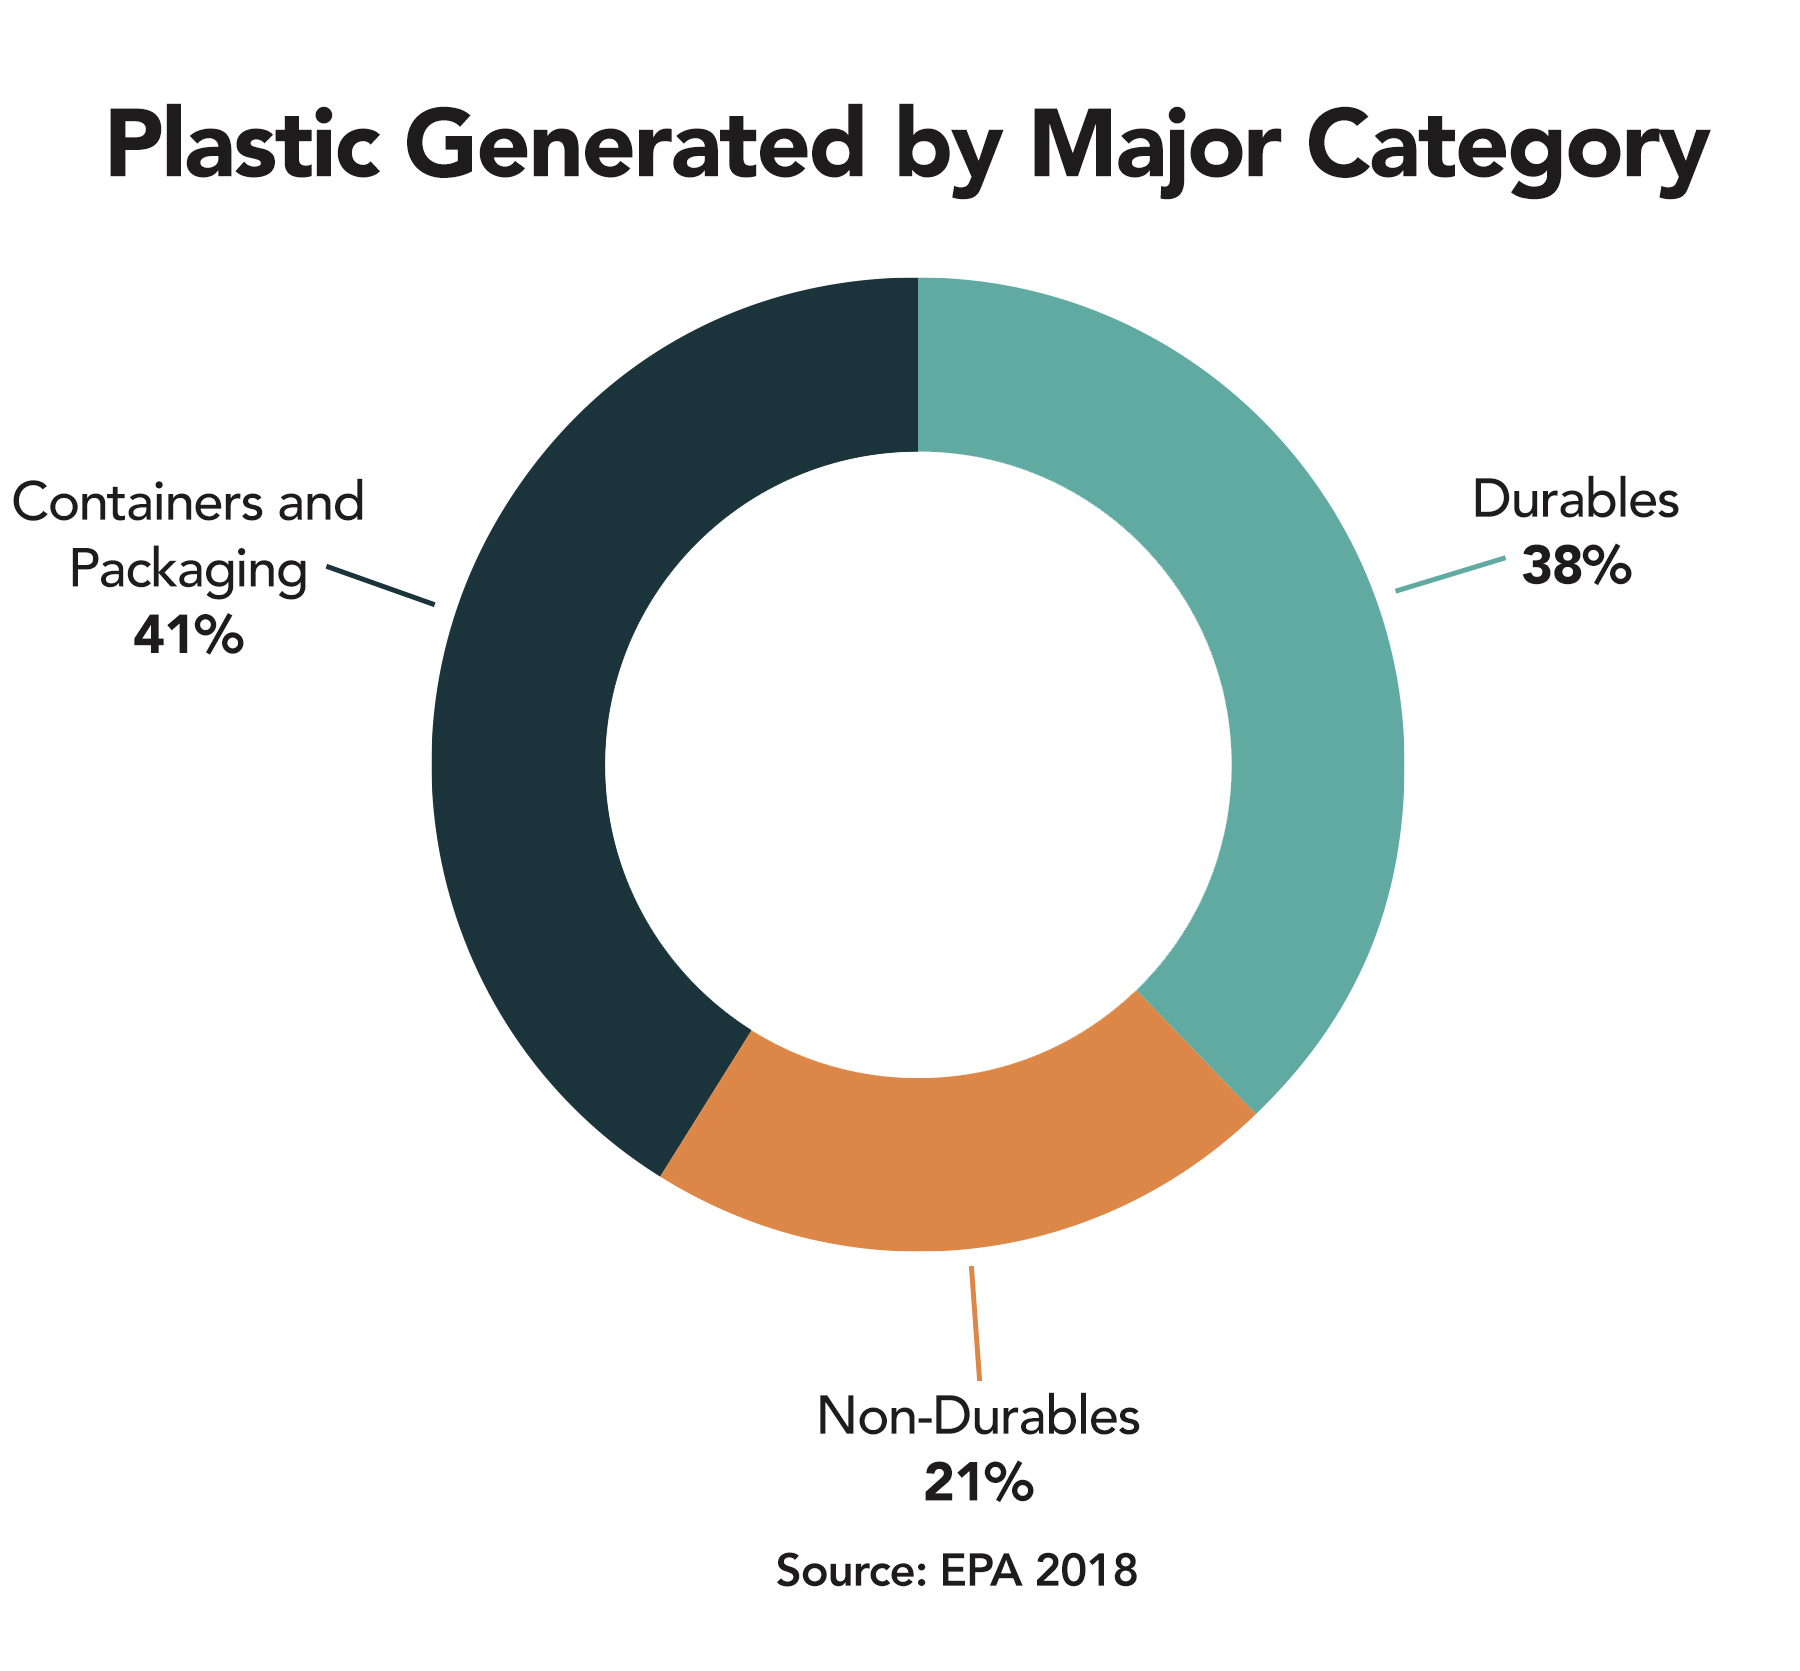
Brandon noted that it could be beneficial to shift the focus of the chemical recycling conversation — for example, even though most of the conversation in the U.S. is about packaging, which is nearly 40% of the plastics used globally and a high contributor to marine pollution, “there are other plastics out there that we’re not talking about that will be really challenging to mechanical recycling.
“If we can focus on purification technology, truly recovering those plastics in other sectors, not generating hazardous waste and not harming communities, there could be a pathway there,” she said. “These technologies are not the right technologies for packaging conversations.”
What she doesn’t want to see is a “feed-the-beast” situation where big, expensive facilities are built and then create pressure to keep producing plastics for feedstock.
Looking to the future
ICIS doesn’t offer a formal chemical recycling forecast, but it does take a cumulative look based on plant and capacity announcements, Dill said. He predicted that chemical recycling will see growth around 10 times that of the current capacity.
“How I always frame this is that you could think about that like a theoretical maximum,” he said. “So we’re likely not going to break above that, but we’re likely not going to realize all of that. It should be a percentage of that.”
That growth level “shows that some things are going right,” he said. “There’s this confidence because these players are announcing these things.”
There’s also a 60-40 split between pre-commercial pilot facilities and commercial level facilities, he said, which is normal at this stage: “In the future, those numbers will likely reverse.”
However, there are certainly hurdles, Dill said, and a big one is feedstock. There used to be “this idea that chemical recyclers could handle anything at all — whatever dirty bales come, we just put it into whatever reactor and get a product on the other end.” But as pilot plants started scaling up, operators realized some level of pre-processing is necessary, and making that kind of change to an already established model can be difficult.
A second challenge is scaling up, Dill said, as it’s a more complicated process than just making the pilot equipment larger. The current macroeconomic situation is also a barrier.
Bauer noted that Resynergi chose to stay fairly small for several of those reasons.
“We’ve proven in our pilots this particular reactor size with this particular technology, and we’re just going to repeat that over and over again,” he said. Compact size also allows Resynergi’s technology to be co-located with existing MRFs, Bauer said, “going to where the plastic is already collected for you.”
Resynergi will have several sites up and running soon, along with some big partnership announcements, Bauer added.
“It’s going to take time — it’s the chicken and the egg — for players like us to show that it really truly can be done in volume at all locations and for people to collect more and more,” he said. “They grow on each other. Maybe it’s a 20-year thing, but I sure hope it’s a five-year thing.”


 Collaboration and Good Data Are Essential for Progress
 Shed Light on Misinformation
 Recycling is Part of the Solution & We Need Greater Measurement