


This article appeared in the July 2025 issue of Resource Recycling. Subscribe today for access to all print content.
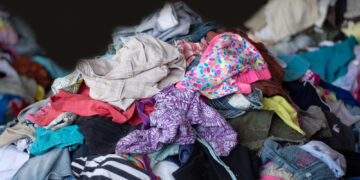
A new global report launched last month shows that deposit return systems (DRS), more commonly known in the U.S. as “bottle bills,” cut beverage container litter by more than 50% on average across Europe, the U.S. and Australia. That figure alone should catch the attention of state lawmakers, but it’s the cost behind the litter, and who pays for it, that should make DRS a top priority.
States are spending millions annually to clean up littered beverage containers, and in many cases, those costs fall on taxpayers and municipal budgets. In North Carolina, for example, a recent study found that at least $56.3 million was spent in 2023 alone to clean up 14.6 million pounds of litter. This includes $32 million contributed by the North Carolina Department of Transportation, $22.4 million contributed by local governments and $1.9 million contributed by nonprofits.
These costs don’t even account for the full societal impact of litter, including lost tourism revenue, harm to wildlife, clogged drainage systems and degraded public spaces. Nationally, the financial burden is far greater: a 2009 Keep America Beautiful study estimated that public, private and nonprofit organizations across the U.S. spend over $11.5 billion each year cleaning up litter, a figure that almost certainly underrepresents today’s cost given inflation, population growth and increased plastic consumption over the past 15 years.
Beverage containers are a leading source of litter
Despite the well-documented harms caused by litter, some critics argue that beverage containers make up only a small fraction of the overall waste stream — calling into question the need for specialized systems like DRS. But global and national data tell a different story.
According to the Ocean Conservancy’s 2024 International Coastal Cleanup (ICC) Report, plastic beverage bottles were the second most frequently collected item worldwide — surpassed only by cigarette butts — with over 1.3 million bottles recovered. In the U.S., Keep America Beautiful’s 2020 National Litter Study found that beer cans, soda bottles and other beverage containers ranked among the top 20 most littered items. The report estimated that nearly 2.8 billion pieces of beverage container litter were present along U.S. roadways and waterways, accounting for approximately 5.6% of all litter nationwide.
Public support is strong, even in states without a bottle bill
As litter costs rise and public frustration grows, DRS offers a rare win-win: it cuts pollution, saves money and enjoys strong bipartisan support across the country. A 2025 poll in Maryland found that a majority (54%) of voters are very concerned about the environmental impact of beverage container litter, and a staggering 90.6% support implementing a DRS to help reduce plastic pollution. That support crosses party lines.
In Rhode Island, a 2025 survey conducted on behalf of Save the Bay found that 71% of residents believe the state’s current recycling system is not working. Fifty-eight percent backed the introduction of a deposit law.
Even in bottle bill states, voters want improvements. A 2025 Siena College poll found that 61% of New Yorkers support increasing the state’s bottle deposit from 5 to 10 cents. Again, support was broad-based, spanning Democrats, Republicans and independents.
This public momentum is not surprising given how visible beverage container litter is, and how effective deposit systems are at preventing it.
What the data shows
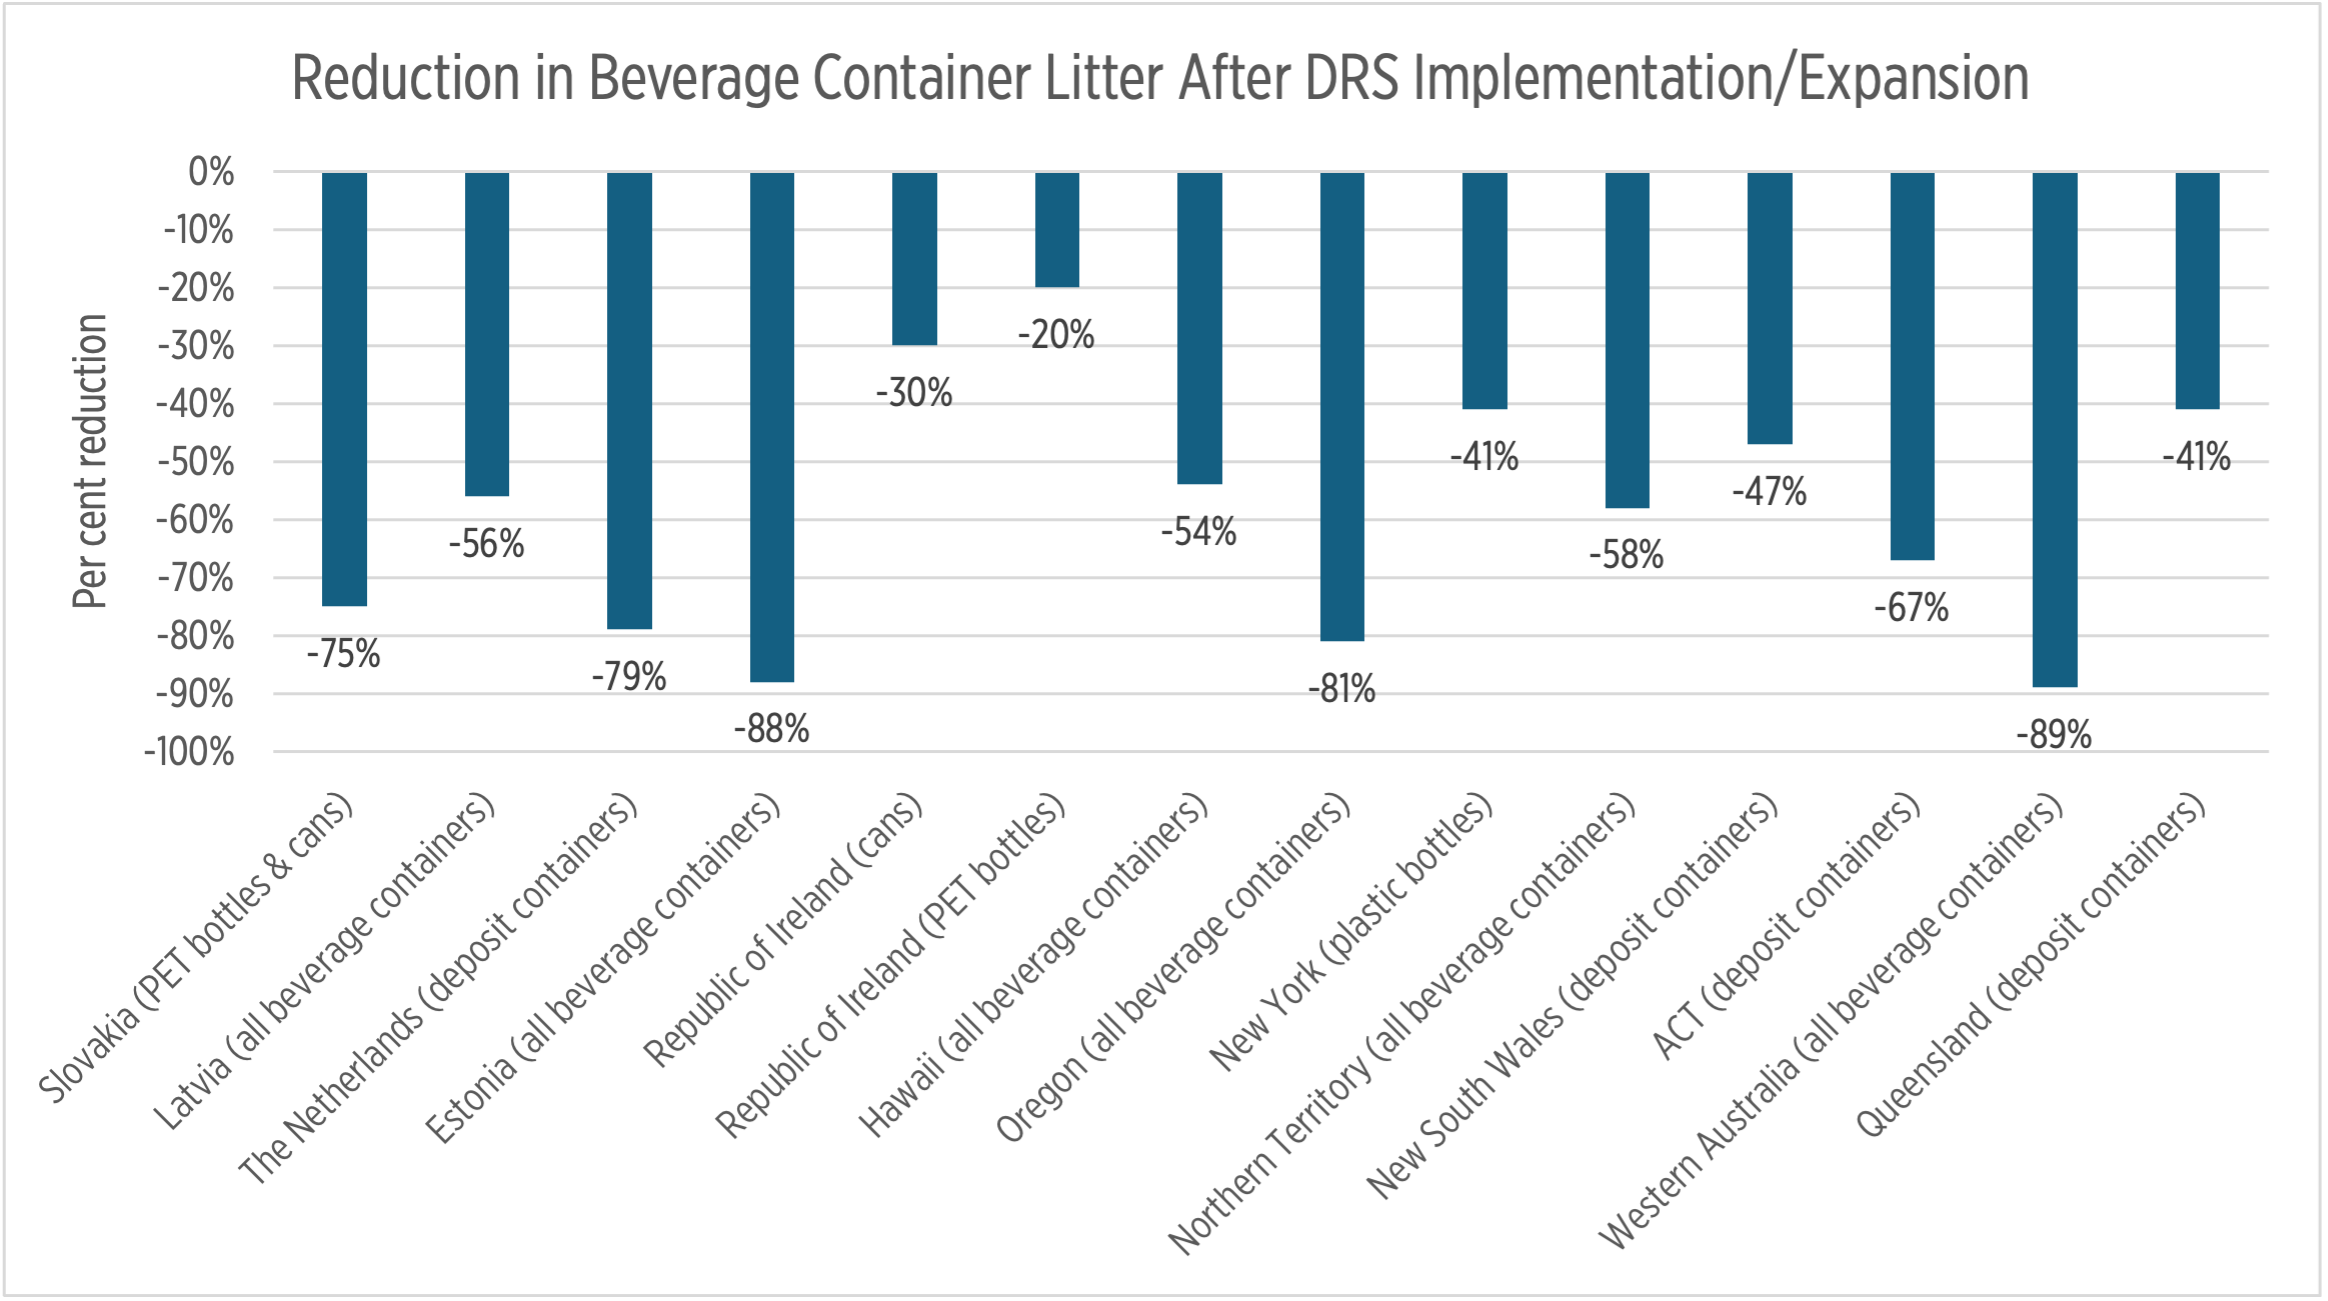
The new report, published by Reloop, is the most comprehensive review to date of the impact of DRS on litter. Drawing on data from over 20 jurisdictions that tracked beverage container litter before and after implementing or expanding a DRS, the report shows that deposit systems cut beverage container litter by more than half, on average, with most studies reporting reductions between 40% and 70% — and in some cases, even higher (Figure 1). These reductions are evident across different geographies and hold true regardless of whether the studies focus on roadside, urban or coastal litter.
In the U.S., Oregon’s DRS provides one of the earliest and most well-documented examples of impact. Before the system took effect in October 1971, beverage containers made up as much as 40% of litter (by count) on Oregon’s roads. Just two years later, that figure had dropped to 10.8%, and by 1974 it dropped further to 7.7%, an 81% reduction compared to pre-bottle bill levels. By 1979, beverage containers represented just 6% of roadside litter, an overall decrease of 85%. Notably, the total volume and count of litter also declined by 47% and 39%, respectively, by the second year, showing that the system helped reduce litter more broadly.
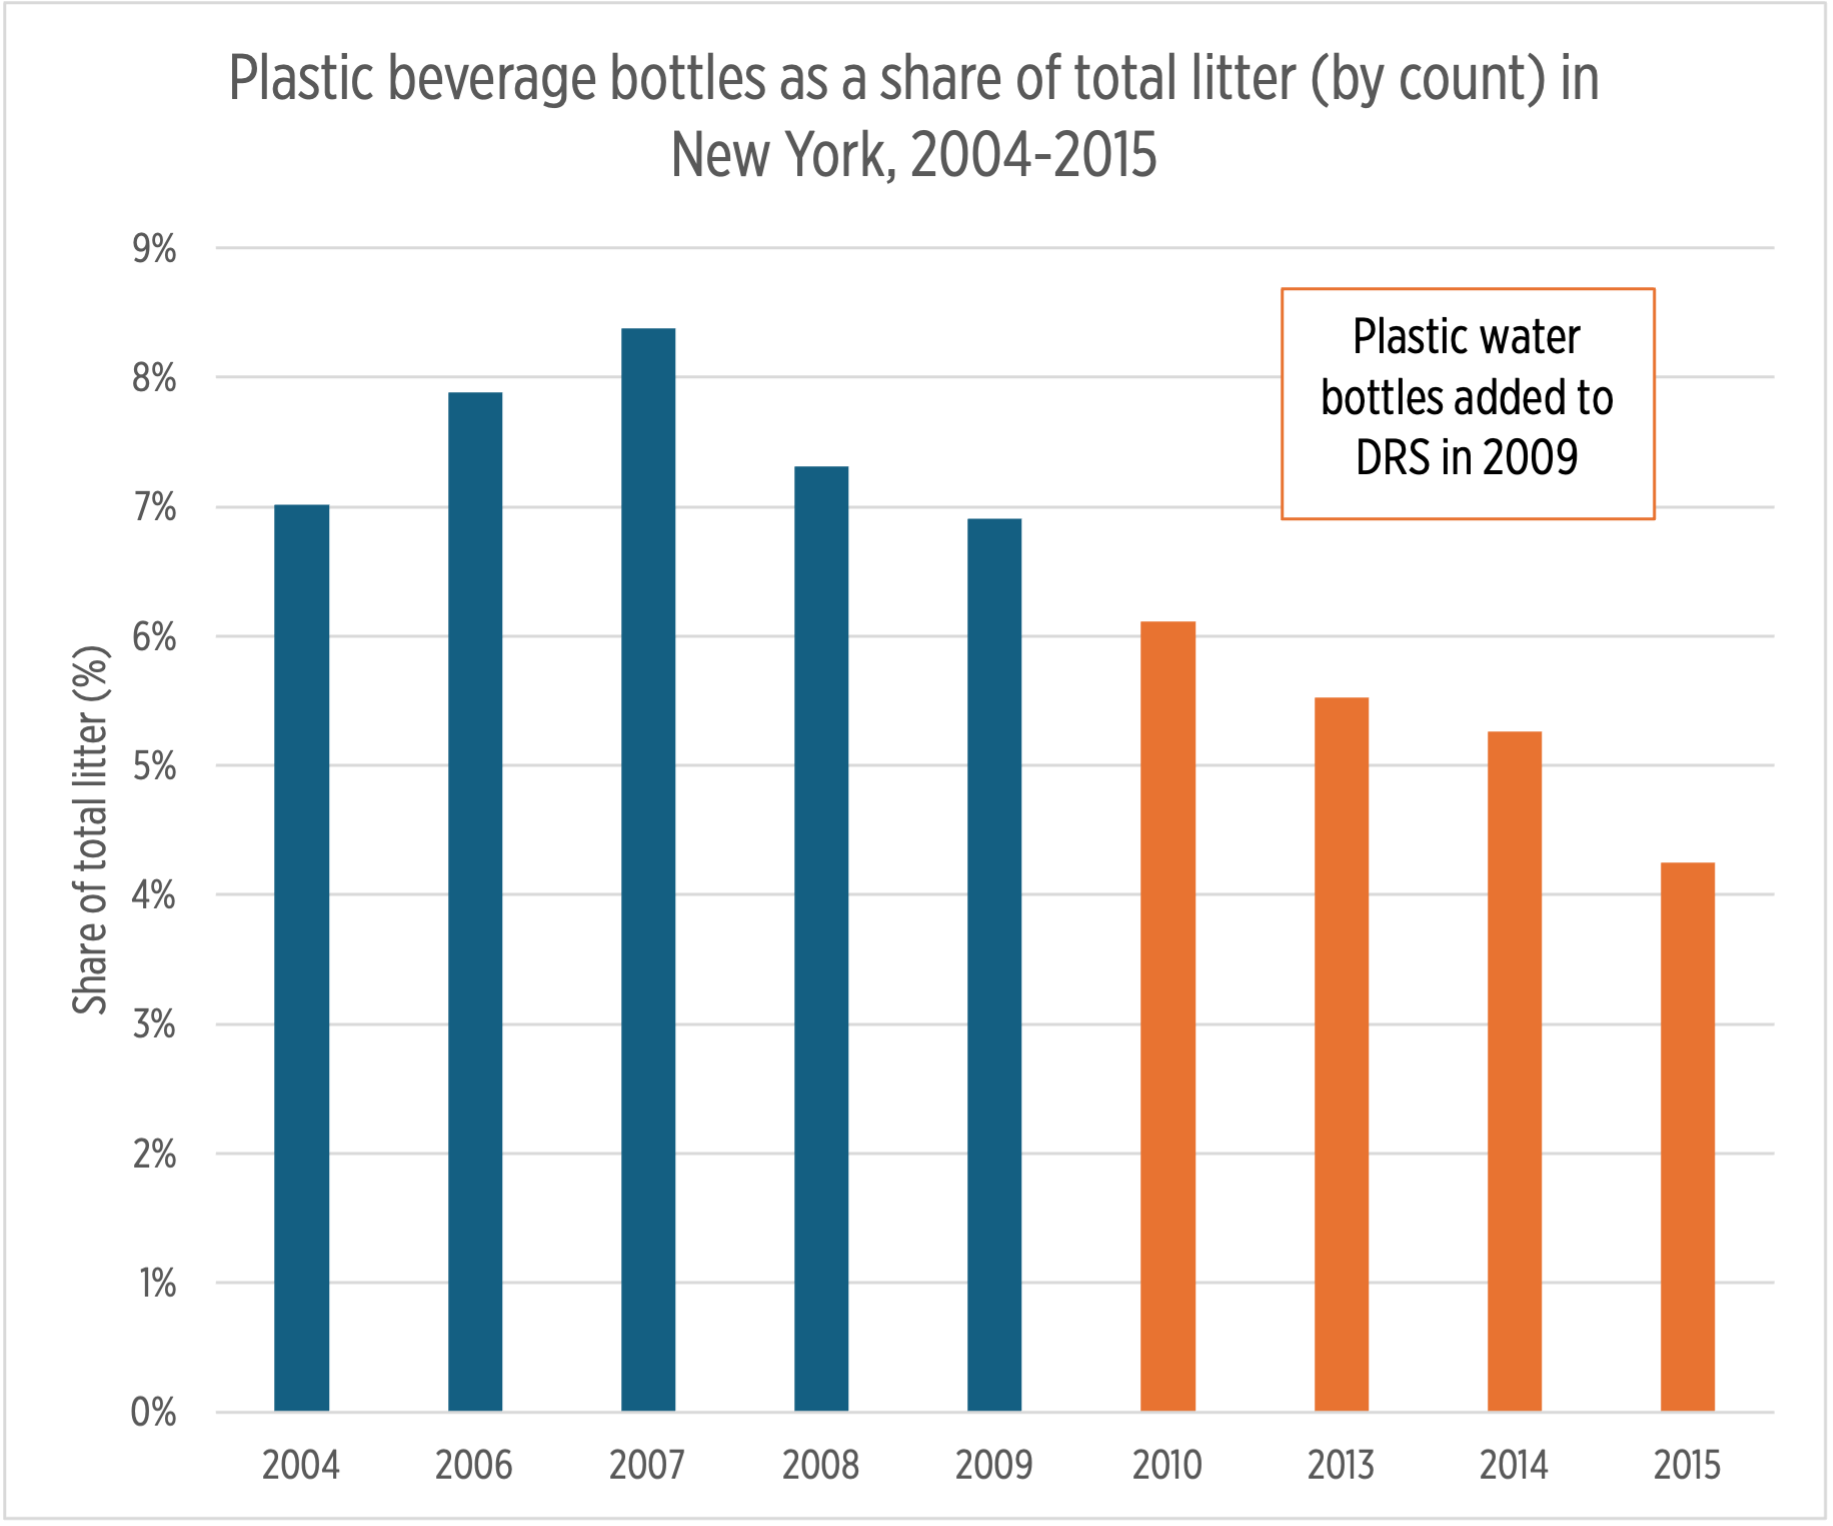
New York’s experience also illustrates DRS effectiveness (Figure 2). In 2009, the state expanded its deposit system to include plastic water bottles. Prior to that, plastic bottles accounted for 7.0% – 8.4% of total litter (2004–2008). By 2010, just a year after expansion, their share had dropped to 6.1%, and continued to fall to 4.3% by 2015, a 41.1% reduction from pre-expansion levels.
Across Europe, recent DRS implementations have yielded similarly dramatic results:
Slovakia launched its DRS in January 2022, applying a €0.15 deposit on metal cans and plastic bottles. Within just 18 months, litter audits showed metal cans dropped from 10% to 2% of total litter (by count), and PET bottles from 11% to 2% — a 78% reduction.
Latvia introduced its DRS in February 2022 with a €0.10 deposit on plastic, metal and glass containers. Coastal litter surveys recorded a 43% decline in deposit container litter in the first nine months, followed by another 22% drop the next year. By 2023, overall deposit container litter had decreased by 56%, with plastic bottles down 69%, aluminum cans 52% and glass bottles 48%.
In Ireland, which launched its DRS in February 2024, early results are promising. A national litter survey in June 2024 found a 30% reduction in drinks can litter and a 20% drop in plastic bottle litter. Separately, Coastwatch Ireland reported the lowest bottle and can counts on coastal shorelines in 25 years, down from 100 per kilometre in 2010 to fewer than 8 in 2024.
While before-and-after studies clearly show the impact of implementing a DRS, comparisons between jurisdictions that have and have not adopted deposit systems offer another layer of insight into how these programs shape litter outcomes.
A 2020 report by Clean Virginia Waterways using Ocean Conservancy’s International Coastal Cleanup data found that beverage container litter was significantly lower in DRS states. Plastic bottles made up just 3.9% of total litter in DRS states, compared to 8.6% in non-DRS states — a 55% reduction. Similar trends held for aluminum cans (2.5% vs. 5.9%, 58% lower) and glass bottles (2.3% vs. 3.2%, 28% lower). Overall, beverage containers accounted for 51% less litter in DRS states (8.7%) than in those without deposit systems (17.7%).
In non-DRS states, plastic bottles consistently ranked among the top three most littered items, while in DRS states they averaged sixth — and didn’t even appear in Oregon’s top ten. Beverage cans and glass bottles showed similar patterns, ranking lower in DRS states.
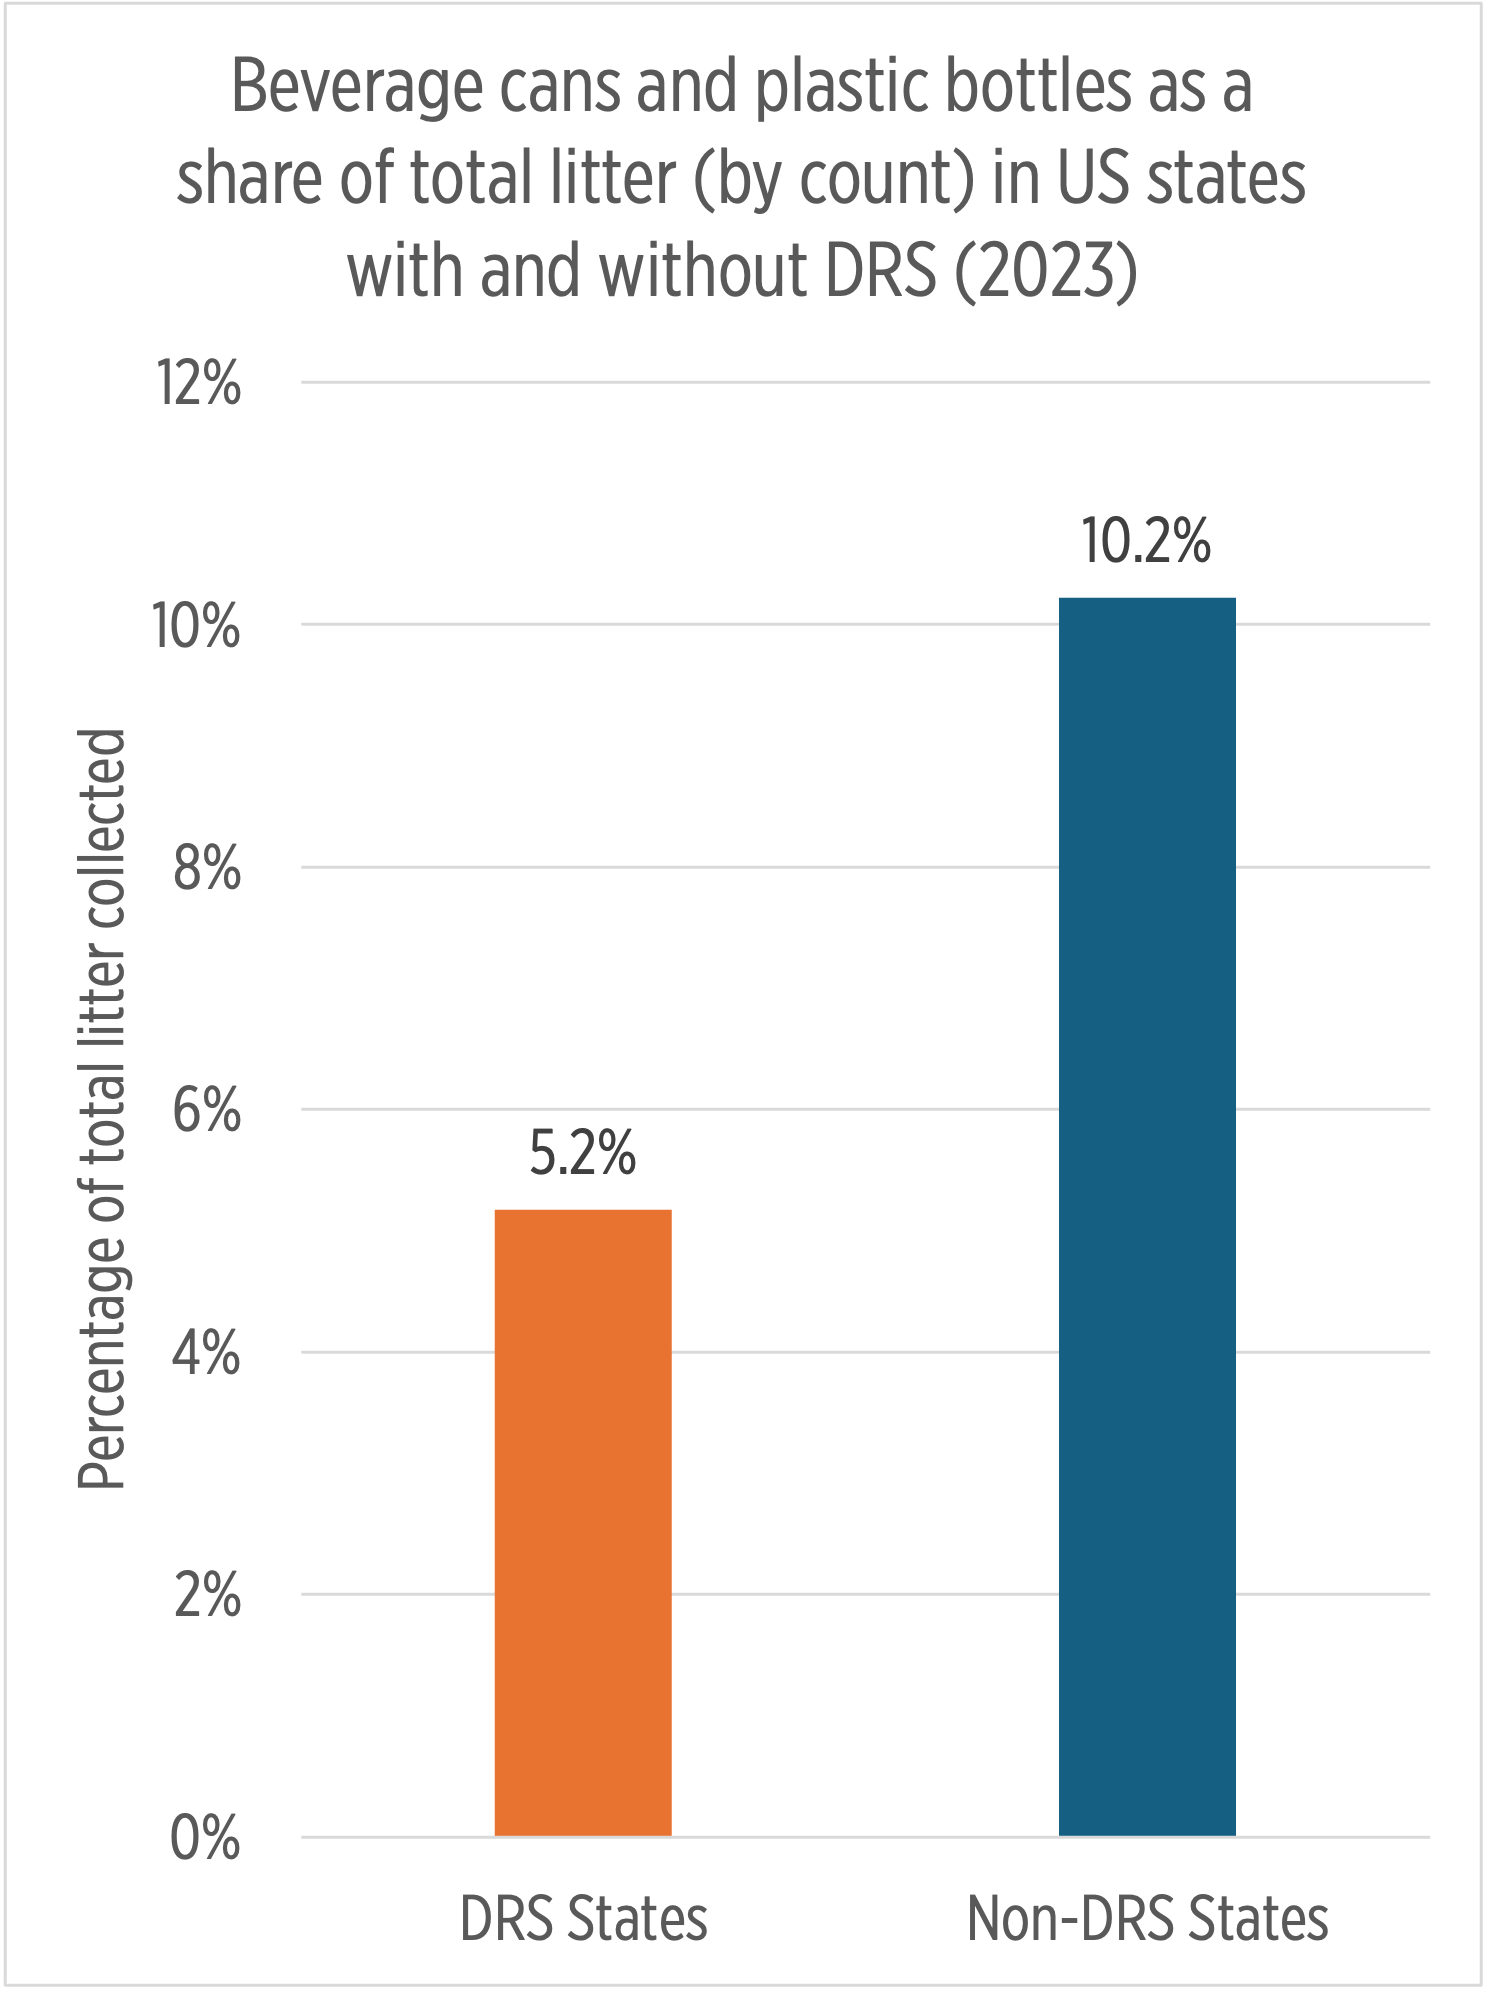
Building on this work, Reloop conducted its own analysis using the same methodology and more recent data from the 2023 ICC cleanup. The updated analysis, based on 42 data points (including litter data from all 10 DRS states and 32 non-DRS states), reinforced the findings of the Clean Virginia Waterways study: in DRS states, plastic bottles and beverage cans together accounted for an average of 5.2% of all littered items, compared to 10.2% in non-DRS states (nearly double the share) (Figure 3). When considered separately, plastic beverage bottles made up 3.0%, on average, of total litter in DRS states versus 5.3% in non-DRS states, while beverage cans represented 2.2% versus 4.9%, respectively.
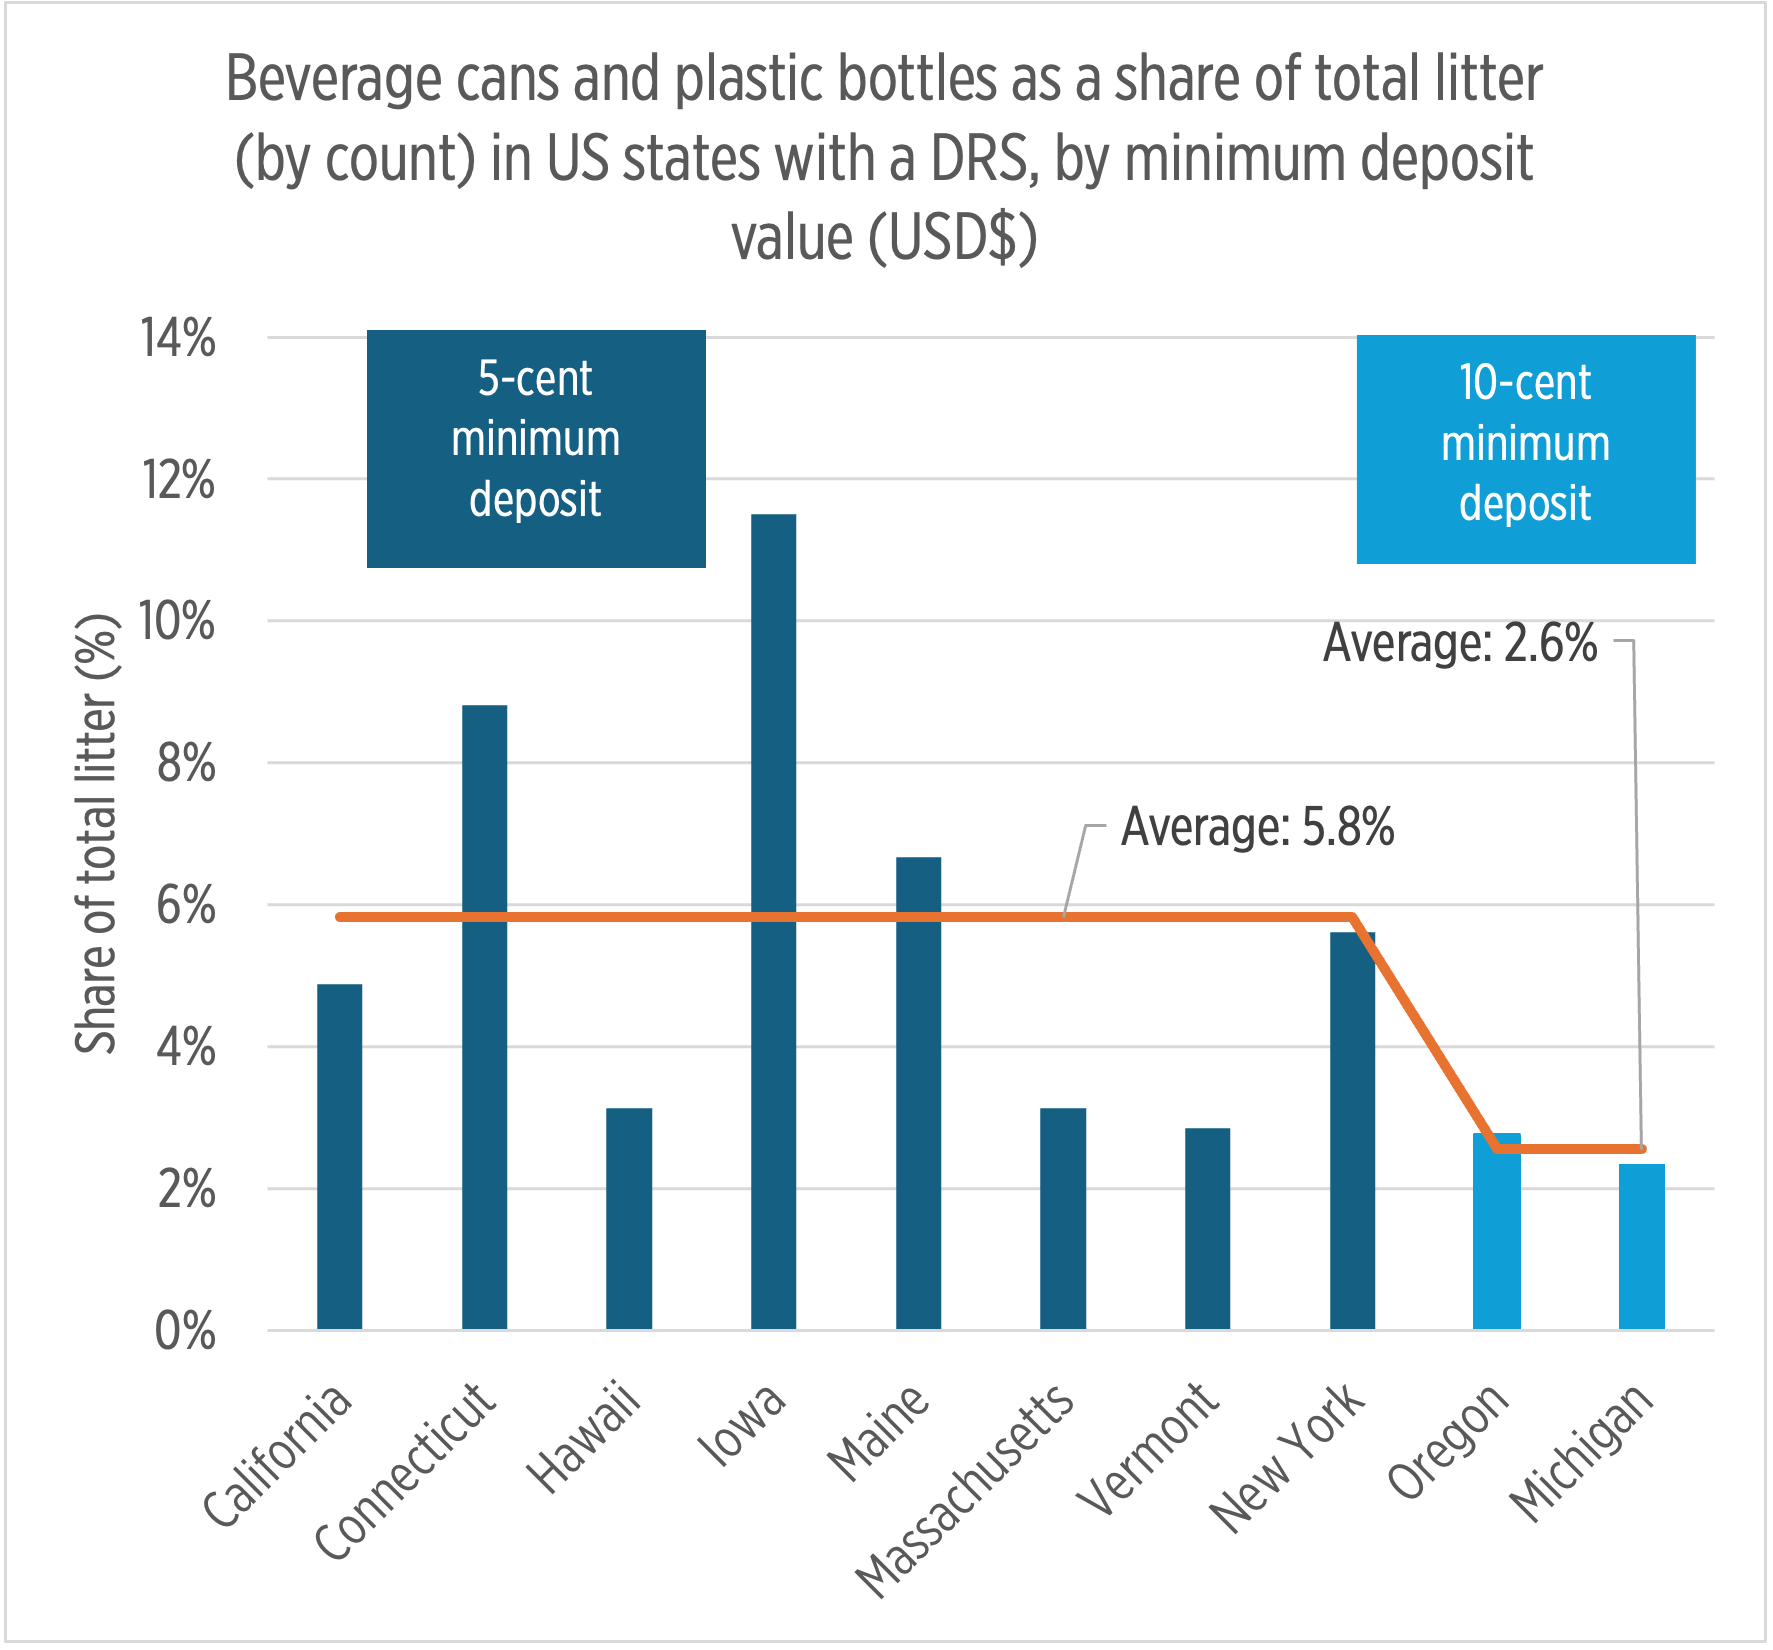
Reloop’s analysis also found that Oregon and Michigan, the only two states with a minimum deposit of 10 cents USD at the time, had the lowest beverage container litter rates, at just 2.8% and 2.3% of total litter, respectively (Figure 4). In contrast, DRS states with a minimum 5-cent USD deposit had higher beverage container litter rates on average, ranging from 2.9% to 11.5%. Although glass bottles were not included in this particular analysis due to limitations in ICC’s data, the trend remains strong: deposit systems are associated with significant reductions in beverage container litter, and higher deposit values further enhance that effect.
Designing systems that deliver
Of course, not all deposit systems are created equal. While the benefits of DRS are clear, performance varies significantly depending on system design. The strongest-performing programs share a few key features:
Meaningful Deposit Values: Systems with deposits of at least 10 cents consistently achieve higher return rates. Oregon, Michigan and now Connecticut have adopted 10-cent deposits and have seen strong results, with Oregon reaching a 90% return rate in 2024. In contrast, most other states still operate with a 5-cent deposit, which offers less incentive to participate.
Broad Scope: Including multiple container types — plastic, metal and glass — reduces consumer confusion around which containers are included and drives greater participation.
Convenient Return Options: Return-to-retail requirements and reverse vending machines make it easy for consumers to redeem deposits.
Design shortcomings in many U.S. states, such as low deposit values, limited container scope and inconvenient return options have led to underperformance. The average return rate across U.S. bottle bill states is around 64%, compared to 83% in modern European systems.
That gap has real consequences: weak system design leaves more containers in streets, parks and waterways. But this can be fixed. By modernizing outdated bottle bills and aligning them with proven best practices, states can significantly reduce beverage container litter and deliver cleaner, healthier communities.
A smart investment in cleaner communities
While differences in methodology and data quality exist across jurisdictions, one message comes through loud and clear: deposit return systems work. Across countries, economic contexts and program designs, the pattern is consistent — when a financial incentive is paired with accessible return options, consumer behavior changes. Education campaigns and curbside recycling have their place, but on their own, they haven’t delivered the same results.
Why are bottle bills so effective? Because they make littering irrational. By assigning a refundable value to empty containers, DRS motivates proper disposal and makes return the default behavior.
Deposit systems reduce litter quickly and significantly, help cut municipal cleanup costs and respond to growing public demand for cleaner communities and effective solutions to plastic pollution. As policymakers weigh the costs and benefits of introducing or expanding DRS, this new body of evidence provides a clear signal.
Clarissa Morawski is the CEO and co-founder of Reloop Platform, an international nonprofit focused on advancing circular economy initiatives. She can be contacted at [email protected].
Samantha Millette, research and analysis manager for Reloop Platform, can be reached at [email protected].