

Frantic00/Shutterstock.
This article appeared in the August 2024 issue of Resource Recycling. Subscribe today for access to all print content.
Despite lagging federal data on recycling, collections genuinely appear to have hit a ceiling across the U.S., several leaders in the recycling industry said in recent months.
When George Smilow, chief operating officer at New York-based PQ Recycling, started his career back in the 1970s, “I believe there were about 50 to 60 PET reclaimers in North America, and the return rate was 30%,” he said during Resource Recycling’s Plastics Recycling Conference in March. “Today there are about half, and the return rate is about 27%.”
AMP founder and CEO Matanya Horowitz echoed the sentiment during a July webinar on the company’s advancements in integrating AI into MRFs to capture material more efficiently.
“Despite all the innovations and technology, despite all the investment, despite all the effort of operators and different stakeholders in the industry, recycling rates have been stagnant for about 15 years here in the United States,” AMP founder and CEO Matanya Horowitz said during a July webinar on the company’s advancements in AI and robotics, for example.
“It’s unfortunate when you have broader macro trends that should be supportive of the recycling industry,” such as broad interest in society’s natural resource usage, Horowitz added.
The current stagnation followed a multi-decade runup in the U.S. recycling rate, which slowed to a halt around 2010. The nation has struggled to hit 35% since then. U.S. EPA data for 2015 show a 34.7% recycling and composting rate, nearly the same as 2014, which clocked in at 34.6%. In 2017, the rate broke 35%, but just barely. Then in 2018, the rate dropped to 32%, though the drop was partially due to a change in how the rate was calculated.
The agency hasn’t updated its once-annual U.S. Facts and Figures diversion report in nearly four years. An emailed statement said one of the biggest challenges is that data collected from states and territories isn’t standardized: “If EPA had a magic wand, we would use it to collect a uniform and comprehensive waste dataset from every state and territory.”
Looking at other data, The Recycling Partnership estimated that the recycling rate of residential recyclables is 21%, which it noted is lower than past estimates due to the inclusion of film and flexibles.
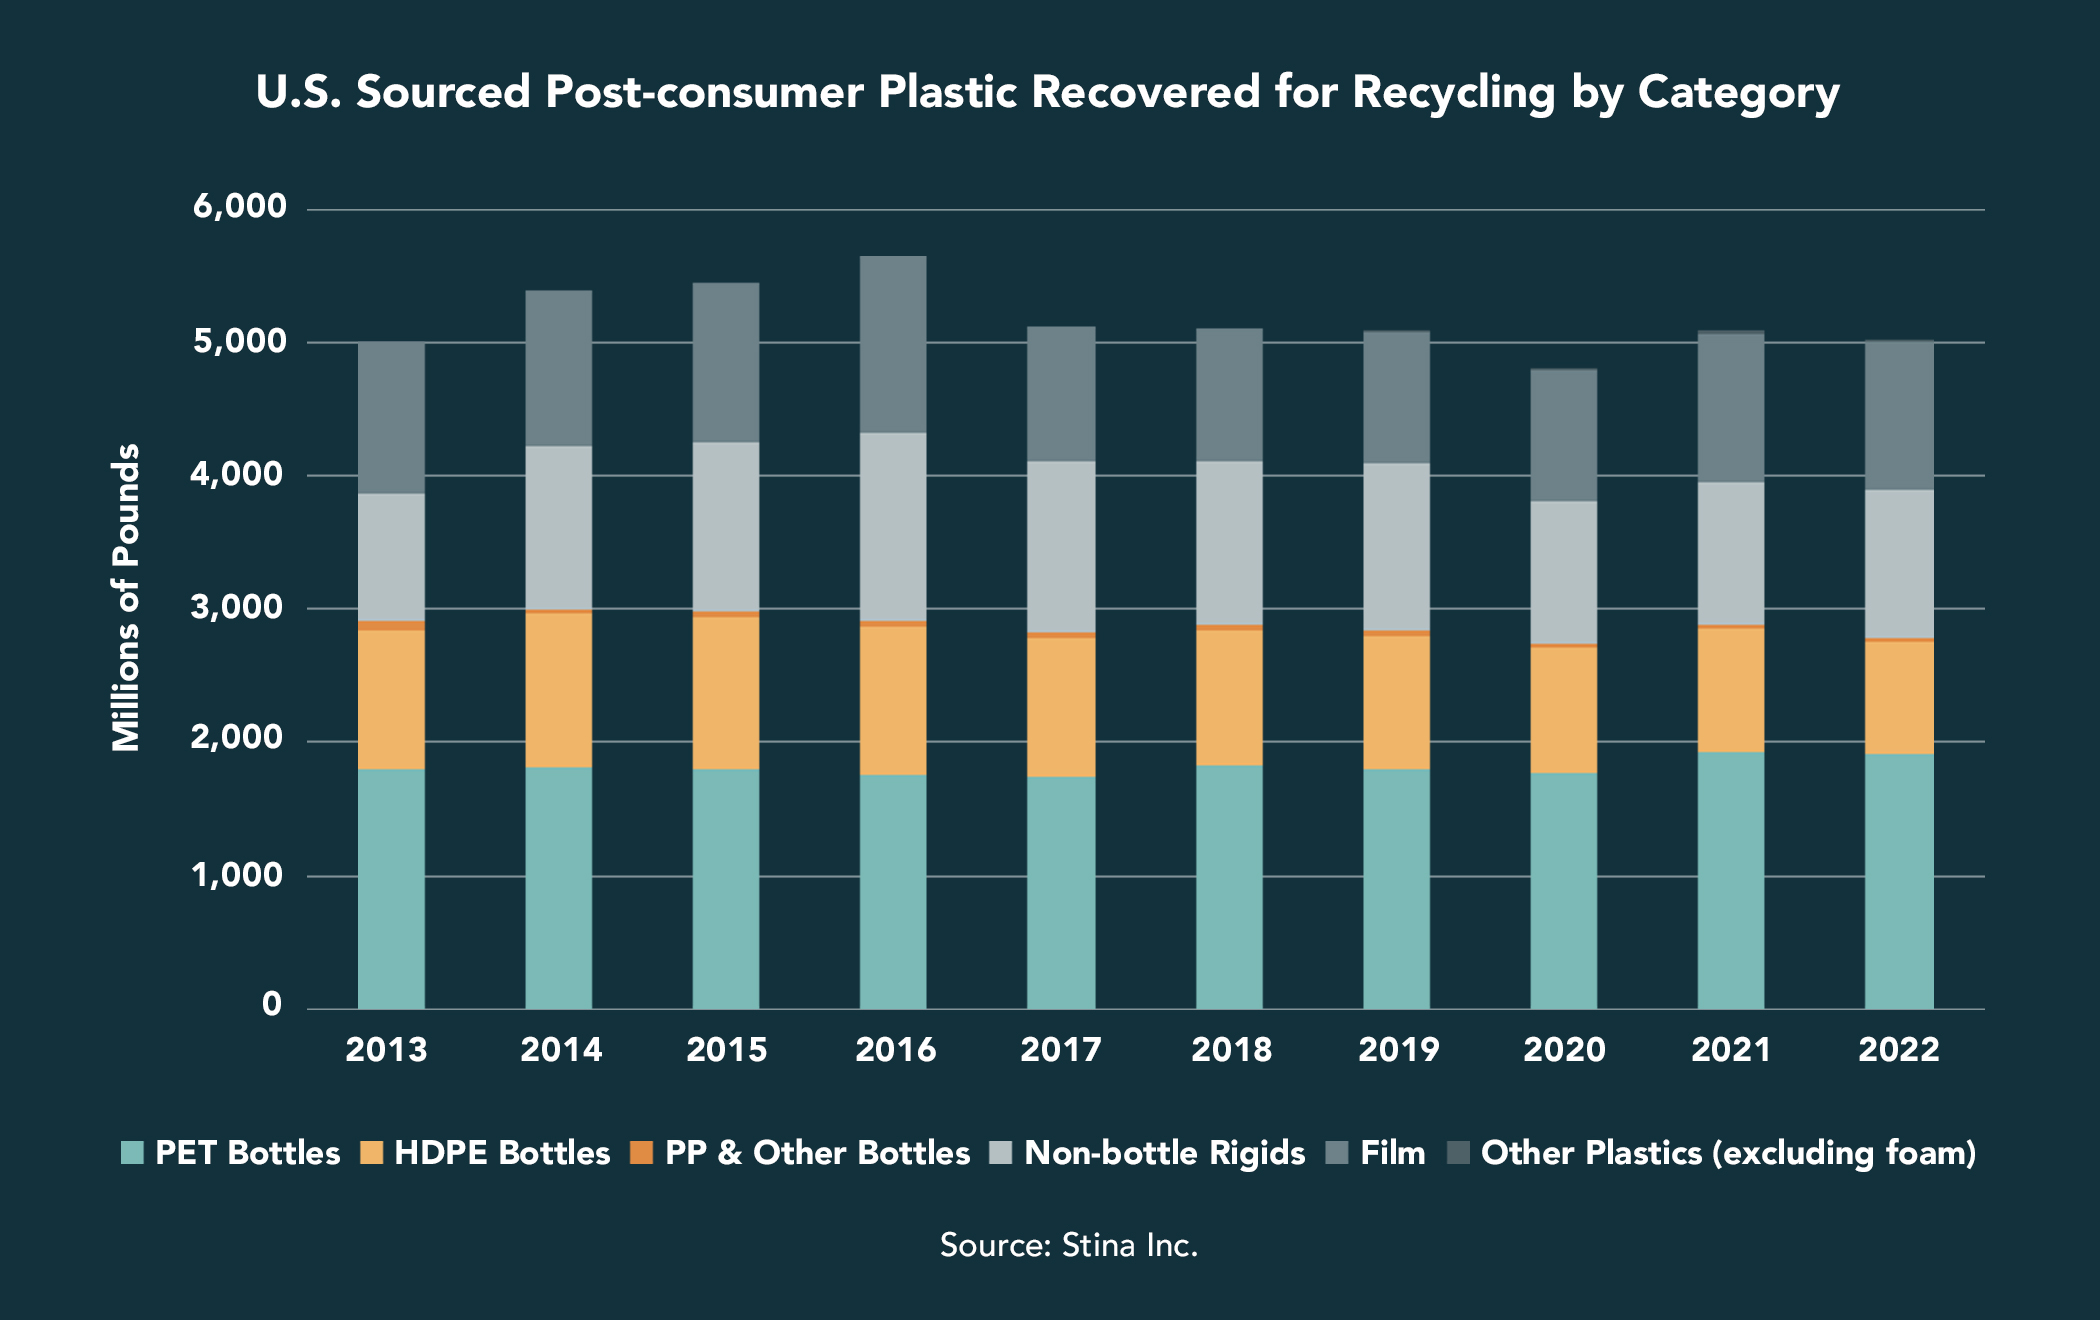
Plastic specifically also saw a decline in recycling in 2022 compared to the year before, according to the 2022 U.S. Post-consumer Plastic Recycling Data Dashboard, which was prepared by Stina Inc. and released by the Recycled Materials Association, the U.S. Plastics Pact and the Association of Plastic Recyclers (APR owns the publisher of this magazine). About 5 billion pounds of post-consumer plastic were recovered in 2022, a drop of 71 million pounds, or about 1.4%, from 2021. In 2021, that dashboard showed an increase of 285 million pounds over the prior year.
Single-stream sets the stage for volume growth
Setting aside the data disparities and measurement methodologies, a straightforward narrative helps explain the last three decades in recycling diversion trends, said Brent Bell, vice president of recycling for WM, the nation’s largest hauler. The rapid growth in recycling collection and diversion rate during the 1990s and 2000s ties to both the start-up of many curbside recycling programs and a nationwide shift from dual-stream and towards single-stream. The ease of all-in-one-cart recycling meant residents could simply send more materials into the recycling stream.
“That’s when you saw more single-stream programs start to take off, and along with that, throughout that time, people got rid of their little 18-gallon toters that were basically just designed to collect newspaper and have a few bottles and cans on top of it, to the actual 64- plus, 96-gallon carts,” Bell said. “I think that’s when you saw the big convenience factor get pushed in with single-stream, saying, ‘Hey, put it all into one bin: Bottles, cans, paper, cardboard, we’ll collect it all.’”
When the municipalities WM serviced would convert from dual- to single-stream recycling, Bell said the company saw an average 40% increase in the materials it collected in those programs.
Additionally, recycling programs were adding in materials that carried a lot of weight: Glass was a huge portion of the recycling stream in the 1990s. Far more beverages were bottled in glass rather than plastic, more cosmetic products came in glass packaging, and glass was one of the largest material streams WM’s recycling operations handled. WM itself actually operated glass recycling plants in that era, Bell noted.
As these changes unfolded, the national recycling and composting rate grew from 16% in 1990, when 33.2 million tons were recycled or composted, up to 28.5% in 2000, when 69.5 million tons were recycled or composted, according to EPA figures. Diversion further increased to 31.4% in 2005 and 34% in 2010.
 Material trends converge, plateauing growth
 Material trends converge, plateauing growth
Then the increase stalled. By 2015, although recycling volume had ticked up to 91 million tons, the rate sat at 34.7%, and there was little change until 2018, when volume was flat but the rate declined due to a change in data methodology. What happened?
Bell says there were several concurrent trends that played into that stagnation. One component was the decline of a huge portion of the recycling stream, newsprint, as consumers increasingly turned to online news, which temporarily reduced the volume of fiber coming into the recycling stream. Newspaper recycling fell by half from 9.36 million tons in 2005 down to 4.79 million tons by 2015.
“We were all sitting there like, ‘Wow, what’s going to replace newspaper?’” Bell recalled. At the time, e-commerce was on the rise, and recycling stakeholders wondered if fiber recycling was on a permanent downward slide as the world went digital.
Of course, e-commerce required packaging, and a new trend for fiber recycling was born. Corrugated boxes drove up the percentage of OCC in the recycling stream, providing a replacement for the loss of newspaper. Corrugated box recycling increased from 22.1 million tons in 2005 up to 28.9 million tons in 2015, more than making up for the newspaper decrease during that period.
Separately, Bell pointed to the emergence of lightweighting across packaging streams.
“Whether it’s your aluminum can, your plastic bottle, even your cardboard, we saw this massive lightweighting come into place,” Bell said. WM calculated that with PET bottles, the company had to collect 1 million bottles to get the same weight of material it used to get by collecting 600,000 bottles pre-lightweighting.
Finally, the decade between 2010 and 2020 brought a massive recycling industry disruption — one that was arguably directly connected to the factors that brought such a rise in recycling tonnage and rate. Unpacking this disruption, its cause and its effect on recycling volumes requires a brief reminder of the recycling markets of the 2000s and early 2010s.
Market upheaval spurs upstream quality focus
The rapid growth of U.S. recycling tonnages required buyers for those collected materials, and for years, the Chinese market was far and away the primary buyer for the paper and plastic streams.
In 2013, for example, the U.S. recycled 43.4 million short tons of paper and paperboard, according to the EPA figures. And that year, 14.7 million tons of that material was exported to China, or 34% of all fiber recovered in the U.S., according to the U.S. Census Bureau, which maintains export figures.
The plastics recycling sector was also reliant on China: In 2013, the U.S. collected 5.98 billion pounds of scrap plastic, and the country exported 2.22 billion pounds to China — 37% of all U.S.-generated scrap plastic.
That heavy reliance on a single export market meant any changes in that market would have an outsized impact on U.S. recycling. Beginning in 2013, such changes began to emerge as China announced its Green Fence operation, which was marked by heightened inspections of inbound loads of scrap materials. The effort was a response to high levels of contaminants discovered in imported loads of recyclables, and the government began enforcing previously lax regulations banning contaminated loads.
Four years later, China ramped up its focus on rejecting contaminated loads with the National Sword campaign, and it ultimately stopped allowing imports of virtually all scrap plastic and mixed paper. The Chinese government’s decision was tied to an unintended consequence of single-stream recycling: With greater convenience often comes greater contamination.
“We had contamination levels above 25%,” Bell recalls. “We had to go and really come out with education programs, try to make sure people are recycling the right items, that they’re cleaning up their stream, not putting a bunch of stuff in there.”
The Chinese government regulations forced a shift in thinking in U.S. recycling programs, marked by a need to focus on quality of recyclables, not just quantity of material collected.
“The industry kind of said, ‘Hey, let’s hold on with the growth, let’s clean this up first, and then let’s go back to how we can get more material in the bin, once it’s cleaner.’” Bell said.
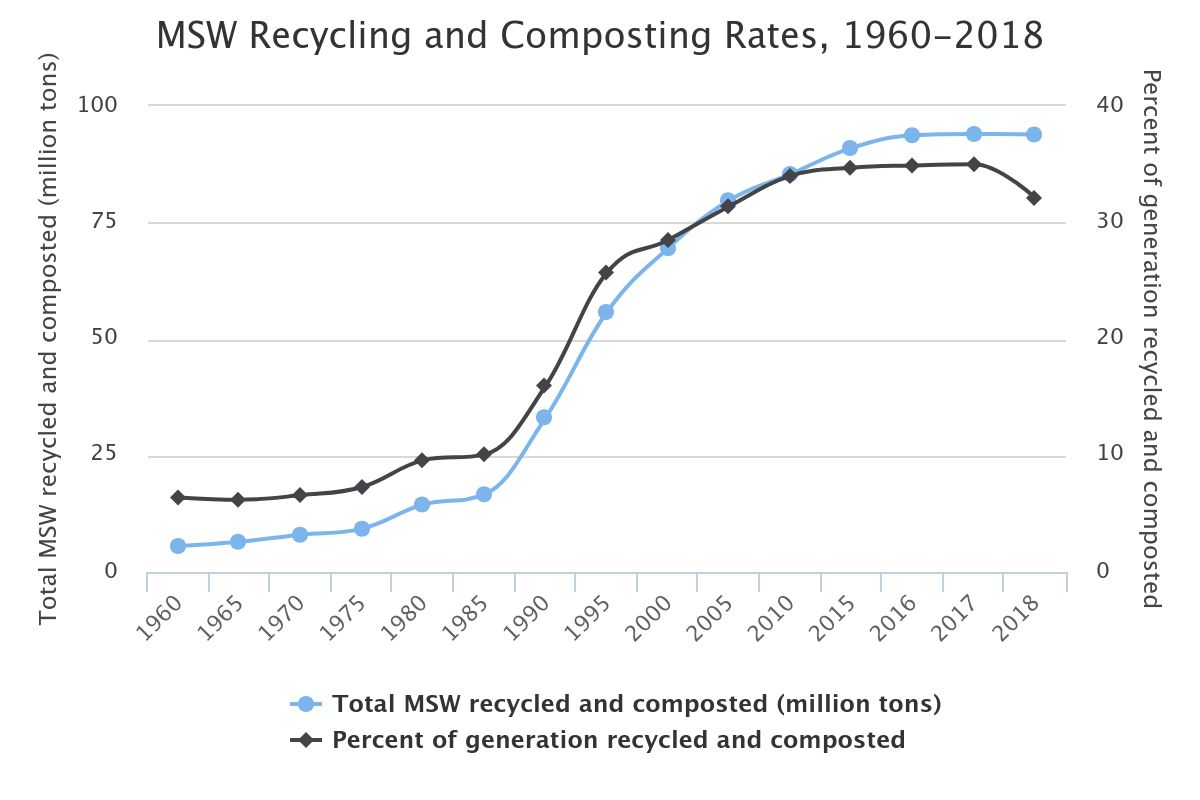
Source: U.S. Environmental Protection Agency
Pushing beyond 34%
The EPA said in an emailed statement that it aims to update its “Facts & Figures about Materials, Waste and Recycling” report late this year, and is “in the process of revising our measurement methodology to improve future data and will publish an analysis of our findings.”
“One of the biggest challenges in producing national estimates is states have different reporting requirements and measurement practices,” the agency noted. “More consistent measurement methodologies are necessary to improve recycling system performance across the country. These more standardized metrics can then be used to create effective national goals and track progress.”
The extended producer responsibility laws for packaging that have passed in five states will certainly help with that. The EPA noted that the reporting requirements in those laws “should help improve the accuracy of the national recycling rate as EPA develops an approach that uses more of the states’ data.”
In the past, the EPA largely used data reported by industry, but that is also not uniform, and made it difficult to answer other questions, such as how much contamination is present in collected recycling.
“Given that the methodology varied by waste type depending on the data available, it is unclear how much ‘contamination’ was factored into past recycling rates,” the EPA said. “We are working to improve our measurement, including supporting state efforts to improve their measurement capabilities. One of the goals of our improved methodology is to account for contamination.”
In the absence of recent EPA diversion data, it’s difficult to say where the country sits now in terms of annual diversion. But even without the current numbers, several avenues to pursue additional diversion are clear.
States with deposit programs consistently have some of the highest recycling rates in the country for bottles and cans, according to the “50 States of Recycling” report from Eunomia and Ball Corporation and other data sources. A recent MIT study projected that a nationwide 10-cent deposit on PET beverage containers could more than triple their recycling rate.
There’s untapped potential in the multifamily recycling sector, as only 37% of U.S. multi-family households have recycling access, The Recycling Partnership reported early this year. Public space and commercial recycling availability lags behind household recycling access.
And there is broad room for improvement in certain material streams outside of the blue bin. In 2019, the U.S. generated 66.22 million tons of food waste, for example, and 74% of that material was either landfilled or disposed of via controlled combustion. There is a huge opportunity to increase the composting rate, which sat at 5% in 2019.
“Convenience, access and behavior changes are probably on the top of that list,” Bell said. “And then making sure that the brands are using material that can be recycled.”
WM itself has made technological inroads in food waste recovery. Bell pointed to the company’s San Leandro, California, “organics MRF,” a facility that separates garbage from the recycling stream and separates out organics for anaerobic digestion.
“If you’re trying to get off of that 30% recycling rate plateau, we absolutely have to go after organics and other types of material that’s currently destined for the landfill,” Bell said. “So I kind of look at it from a broader perspective, not to get too stuck on the EPA’s percentages — even though we look at them all — but to say, hey, what’s the best way to unlock more material that could be going to the landfill? And organics is the next big portion of that.”