China’s National Sword and the evolving packaging stream have pushed up net recycling costs by nearly 13% in Canada’s largest province.
Recently released financial figures show that commodity sales revenue in Ontario plummeted in 2019, even as collection and sorting costs continued to rise. As a result, stakeholders, including producers of printed paper and packaging, were forced to pay more.
The numbers were published on Sept. 24 by the Continuous Improvement Fund (CIF), an Ontario organization funded by producers and municipalities. A jurisdiction of over 14.7 million people, Ontario has an extended producer responsibility (EPR) system through which producers of printed paper and packaging help fund collection and processing through what’s called the “Blue Box” program. Currently, the province requires producers to pay half the costs, but it is in the process of shifting to an EPR model through which producers fund all of the eligible costs.
The recently gathered data was part of an annual “datacall,” through which municipalities and others providing recycling services report their costs and revenues. That information helps the province calculate the amount of money producers must pay.
Based on earlier data, Ontario program regulators have determined producers must pay nearly $131 million for the 2020 program year.
Worldwide trends affect province’s program
The datacall showed nearly 730,000 metric tons of recyclables were recycled in 2019, at a total gross cost of $384 million (all monetary figures are Canadian dollars). Sales of recovered materials generate revenue to help fund the system, and in 2019, those sales totaled $55 million. That resulted in a net Blue Box program cost of $328 million – or nearly $450 per ton.
The 2019 commodity sales revenue figure of $55 million was a record low amount, according to CIF. As a result, the net recycling system costs were up 12.6% from 2018. It was the second year in a row that net costs rose dramatically, according to CIF. In 2017, the sales revenues totaled $112 million.
The write-up pointed to two major factors as driving the change: Changing markets spurred by National Sword and packaging lightweighting.
National Sword meant stricter enforcement of tight quality standards for bales shipped to China. That had the effect of increasing the quality levels that other markets, including domestic bale buyers, could demand. Some MRFs handling material from Ontario weren’t able to meet the standards for specific materials, resulting in some material going to landfill. Overall, marketed tons dropped from about 871,000 metric tons in 2016 to 730,000 last year, according to CIF.
Single-stream MRFs were most affected. The single-stream sector’s marketed metric tons dropped from 440,000 in 2016 to 323,000 in 2019, a decrease of nearly 27%. Meanwhile, the dual-stream sector’s marketed metric tons dropped from 422,000 to 397,000, down 6%.
At the same time, the tighter standards being demanded in the marketplace drove up gross costs for Ontario’s program by nearly 11% from 2016 to 2019. Collection, depot and processing (sorting and marketing) factor into program gross costs, and processing costs in particular have increased in recent years. In 2019, processing accounted for 36% of gross costs, up from 33% in 2016, CIF noted. The processing costs increased 5% for single-stream MRFs and 1% for dual-stream facilities.
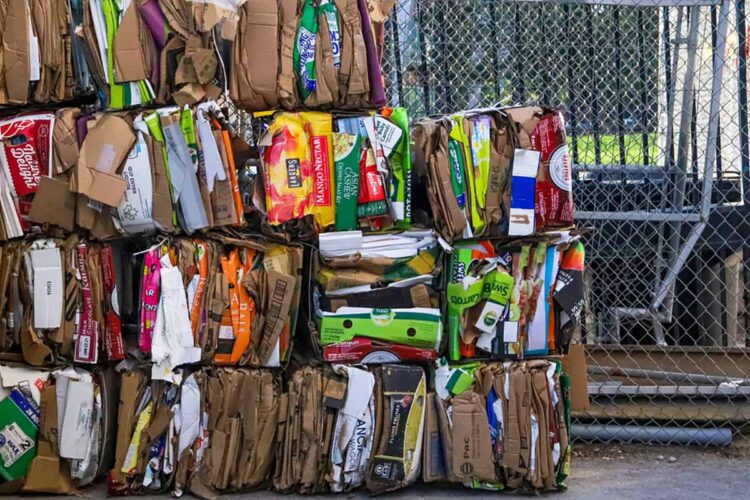
In terms of financially problematic materials, the CIF pointed to printed paper bales. The cost to produce cleaner printed paper bales to meet demand has skyrocketed over the past decade-plus, while the bale value has simultaneously plummeted. As a result, the net cost of printed paper has steadily climbed. Paper packaging – or OCC bales – haven’t seen the same steady net cost increase.
Material shifts pile on
In addition to China’s policies and their follow-on effects, packaging lightweighting and changes in materials – essentially the evolving ton – are increasing gross costs, CIF noted.
In 2008, a metric ton of new aggregated materials sold into the residential market had a volume of about 15 cubic meters (about 530 cubic feet), CIF wrote, citing data produced by a model from Stewardship Ontario. That metric ton sold to consumers now takes up about 21.5 cubic meters (nearly 760 cubic feet).
“The volume of material sold continues to trend upward at a faster rate than the volume of material recovered, illustrating the increasing difficulty in recovering lightweight plastic containers and wrappings,” CIF wrote.
CIF predicts the scenario of rising net costs will continue.
“Additional costs related to COVID-19 work stoppages and slowdowns and the increasing difficulty in getting qualified collection drivers may drive costs up in 2020 and 2021,” according to the group.


