








This story originally appeared in the June 2016 issue of Resource Recycling.
Subscribe today for access to all print content.
In the first installment of this article, we shared the results of some research that aimed to estimate average recyclable material generation by a single American household. We determined that number to be 866 pounds annually, a total that includes material correctly placed in recycling as well as recyclable material that ends up in the trash.
This measurement helps establish a benchmark of ideal recovery for curbside and other residential recycling programs. The benchmark can be easily coupled with data on actual pounds of household recyclables collected per household served in a recycling program to gauge the program’s recovery performance. Read the first installment of our data exploration.
Now let’s explore how our estimate can help us gain insight into North American materials recovery on a number of levels.
Measuring local program performance
For an individual community, the information from this research can help measure overall recovery performance. Any program can make direct use of the study data, and, surprisingly, the numbers can indicate opportunities for improvements for even very good recycling programs.
Consider the case of two progressive recycling communities: Austin, Texas and Asheville, N.C. Both are recovering impressive levels of recyclables per household served, but each is also falling short of the ideal (see chart below). Is this a function of having reached some kind of participation ceiling? Are participating households in each municipality under-recycling? Could it be a combination of these factors? How do these strong programs close the gap between what they are currently recovering and what they could recover?
More broadly, when great programs like Austin and Asheville are only recovering between 55 to 70 percent of the potentially available recyclables, what does it say about the general state of household recycling in the U.S.?
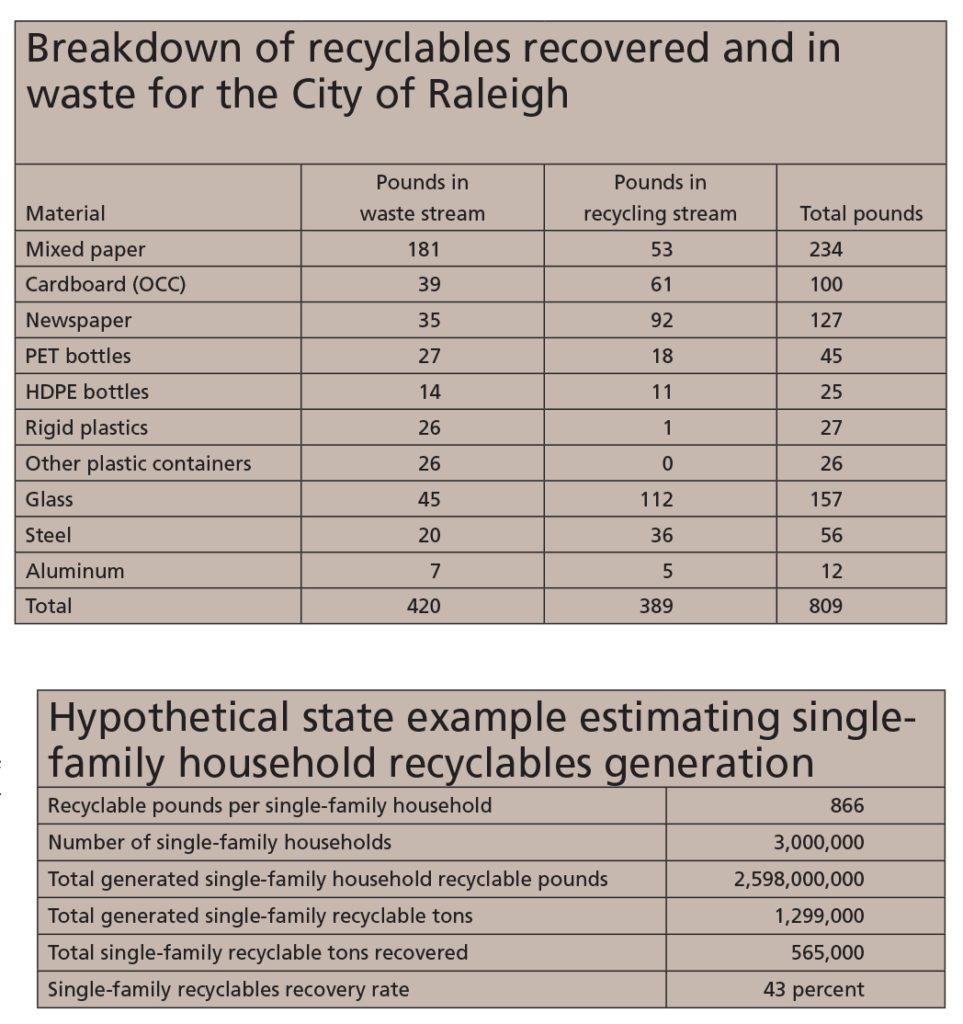
Using the example of the City of Raleigh, N.C., the table below shows that even though the City recovered a respectable 389 pounds per household served in its curbside program, it is only capturing 48 percent of its household recyclables. The data further indicate that citizens seem to have a different understanding of recyclability for specific commodities, with substantial recovery gaps between materials such as newspaper and mixed paper.
Raleigh or any other municipality armed with this kind of data can address discrepancies in individual commodity recovery rates through more nuanced educational messages. In this case, Raleigh might consider aiming public information specifically at increasing mixed paper and plastic container recovery to help raise the capture rate for those particular commodities. By doing so, Raleigh could actually improve the overall blended value of its curbside stream and enhance the possibility of revenue sharing (once commodity prices improve).

 Moving to a macro level
Beyond individual community applications, the data in this research can also be used to get a sense of the overall size of the residential stream as well as a ballpark estimate of commodities present in households. For state recycling programs, the 866 pounds of recyclables per household can be extrapolated to estimate the tonnage of single-family household material divertible toward an overall recycling goal. Combined with data from local recycling programs and other sources, the information can provide insight into how much of the household recovery stream is being recovered, leading to discussions and planning on ways to improve access, increase participation and address under-recycling.
The third table to the right shows a hypothetical calculation of residential recyclable material for a state with 3 million single-family households. The simple model can be manipulated by changing just one variable: the number of single-family households. In that respect, any state, local community, or region can use this process to do their own calculation using a count of single-family households or even the number of households served by curbside or drop-off options.
As we have discussed, a count of served households should be an automatically known quantity, and counts of single-family households can be gleaned from U.S. census data. If a jurisdiction has its own estimate of pounds per household instead of the 866-pound average, planners can use that data in the model. And if the jurisdiction knows its current annual recycling pounds per household served, it can calculate its single-family household recovery rate.
The same kind of analysis can be done on a national scale to determine the size of the single-family household recycling stream in the U.S. Furthermore, if we use the assumption that multi-family households generate 600 pounds of recyclables per year (research is needed in this area), we can then calculate an overall national household recyclables generation rate. The two tables above show these calculations.
Looking specifically at commodities
An additional use of this data is estimating the generation of specific commodities from household sources. In doing this kind of analysis, one can then back into the amount of any particular commodity generated outside of households by using nationally published generation rates. This is important in understanding and crafting recovery strategies for specific kinds of materials. Any particular commodity with relatively high away-from-home generation may require more focus on building recycling access and participation at away-from-home locations, whereas materials with high residential generation rates would clearly call for strategies to optimize household recovery.
As an example of this kind of analysis, the North Carolina Division of Environmental Assistance & Customer Service (NC DEACS) applied its household data to PET generation and estimated how much of the material is generated in single-family households. NC DEACS derives its commodity percentage breakdowns through annual informal surveys of North Carolina materials recovery facilities. Responses from surveyed facilities are aggregated and then averaged to produce proportionate estimates of each of the main commodities in the single-stream mix. For 2015, the average portion of PET in the MRF mix for North Carolina facilities was 4.7 percent.
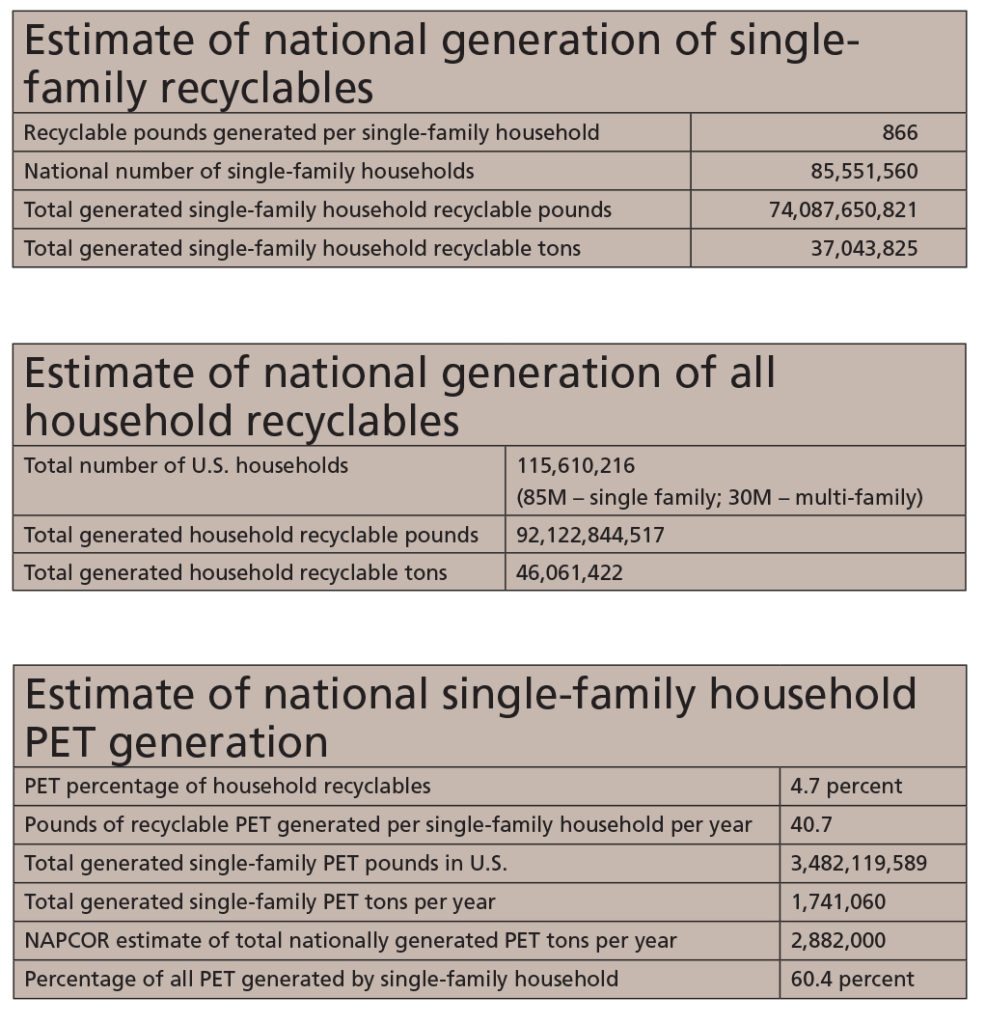 As shown in the numbers in the table above, we estimate 60 percent of PET material in the U.S. reaches the discard stage in the single-family environment. Because the PET bottle recycling rate has plateaued around 30 percent, advocates of PET recycling might want to redouble their focus on improving the basic U.S. household recycling infrastructure.
It must be emphasized that anyone using this data or a similar approach can use different assumptions or ratios in the analysis, ideally based on fact-based evidence that ensures the credibility of the information. For example, as noted earlier, the percentage of PET in household recyclables used in this table is a product of ongoing NC DEACS dialogue with MRFs. Any given region with a solid alternative ratio or an alternative pounds-per-household figure can do the math according to those factors.
NC DEACS has conducted this exercise in part to better inform its own recovery work but also to spur a broader discussion in the recycling profession on producing and using better data. The more entities that are active on this exercise, the better the overall data becomes and the more likely it will produce useful information.
As with any research, the quality and nature of available data has definitely affected this study. One of the critical sources of information for the analysis has been waste composition studies. When one looks at a set of these studies together, it becomes quickly apparent that there are a wide range of approaches to assigning material categories, requiring in some cases the application of a secondary analysis to glean the recyclable components from the non-recyclable. In many cases, the commodity categories did not readily correspond with the materials collected in a community’s recycling program nor necessarily with the commodity profile that a jurisdiction’s MRF actually sorts.
A logical recommendation from this finding is that consulting firms and communities should work hard to get on the same page regarding material categories before a waste composition study is started. If one of the goals of a waste characterization study is to measure the recyclable materials remaining in the waste stream, then aligning the material sort categories with the materials in a community’s collection and MRF mix makes a lot of sense. There is an argument to be made that waste composition studies should be standardized and that ancillary material analyses, such as the EPA Waste Characterization Study, should also be adjusted toward clearer, more consistent categories of recyclable versus non-recyclable commodities.
Starting the conversation
In the first installment of this two-part article, we posed the hypothesis that an average single-family household generates 866 pounds of recyclable materials per year, providing a critical benchmark to gauge recycling program performance.
We also asked a question: Is this household-pounds data actually accurate? We will not truly know without additional research and more data from communities across the country. As much as anything, our study was meant to start a conversation among recycling professionals about what we believe to be a fundamental metric and to spur community recycling programs to pay more attention to gathering and using essential data.
Ideally, the U.S. recycling community can find a way to develop a living process of collecting and sharing data on curbside program performance for all the reasons mentioned above. This data can be a strong antidote to meaningless calculations of “recycling rates” and can put our understanding of both where we are and where we could be with household material recovery on a solid foundation.
Scott Mouw is state recycling director at the North Carolina Division of Environmental Assistance & Customer Service and can be contacted at scott.mouw@ncdenr.gov.
Rob Taylor is team leader of local government recycling at the state agency and can be contacted at rob.taylor@ncdenr.gov.