Notable changes have taken place in markets for curbside recyclables over the past month, including an increase in OCC prices and a steep dive in natural HDPE prices.
Recycling facilities are encountering both good and bad news on the fiber-market front: OCC prices have increased substantially, but mixed paper slipped further into the negatives.
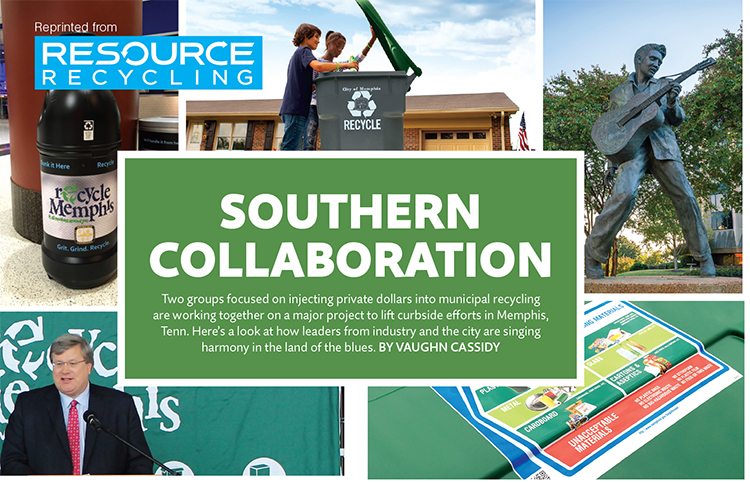
This story originally appeared in the March 2017 issue of Resource Recycling.
Subscribe today for access to all print content.
 Food waste has become an increasingly hot topic in recent months and for good reason. According to the Food and Agriculture Organization of the United Nations (FAO), about one-third of all food produced in the world for human consumption – approximately 1.3 billion metric tons – ends up as waste each year.

An Iowa solid waste commission agreed to pay to help remove lead-containing glass and other electronic scrap from warehouses in Ohio. | mojo cp/Shutterstock
An Iowa solid waste commission recently agreed to pay nearly $240,000 to help fund the removal of materials from old TVs and computer monitors that were abandoned in Ohio.