


The third quarter of the year brought a resilient recovered fiber export market, even as the largest overseas buyer virtually disappeared. Meanwhile, scrap plastic exports continued a precipitous decline.
The U.S. Census Bureau, which is part of the U.S. Department of Commerce, this month released export figures for September 2021, allowing for a third quarter analysis.
Global fiber market adjusts post-China
This year kicked off with yet another Chinese import policy impacting U.S. exports: The country in January enacted a ban on importing virtually all recyclables.
Even after its ban on mixed paper imports in 2018, China had remained the largest importer of U.S. recovered fiber. That changed this year and continued into the third quarter.
China imported 136,000 short tons of U.S. recovered fiber during the third quarter, down from 152,000 short tons in the second quarter and 157,000 short tons in the first.
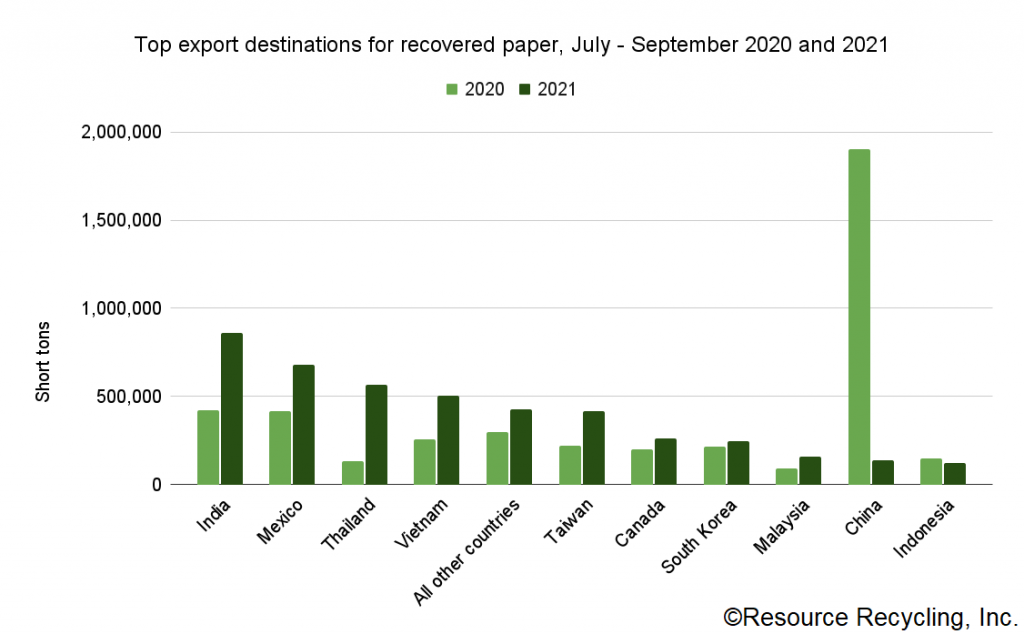
The numbers reinforce that the country continues to enforce its restrictions on recovered fiber imports. The 136,000 short tons in the third quarter is down 93% from the 1.9 million short tons sent to China during that period in 2020.
But the most striking takeaway from the data is that the overall U.S. export volume remains slightly up year over year, despite the substantial decline in shipments to China. U.S. fiber exports totaled 4.38 million short tons during the third quarter, up from 4.30 million in 2020. That follows a similar increase in the first half of the year.
India saw the largest increase, more than doubling its U.S. fiber imports. It went from bringing in 420,000 short tons in the third quarter of 2020 to 859,000 short tons during that period this year.
Thailand went from importing 133,000 short tons in the third quarter of 2020 to 568,000 short tons this year, an increase of 326%.
Other significant increases took place in Vietnam (up 95%), Taiwan (up 91%), Malaysia (up 76%) and Mexico (up 62%).
The top importing countries by weight were India (859,000 short tons), Mexico (678,000), Thailand (568,000), Vietnam (506,000), Taiwan (419,000), Canada (260,000), South Korea (244,000), Malaysia (161,000), China (136,000) and Indonesia (120,000).
Significant increases were seen in smaller export markets as well. Aside from the previously listed top importers, all other countries brought in a combined 428,000 short tons, up from 300,000 short tons during the third quarter in 2020.
In terms of pulp made from recovered fiber, more is being exported from the U.S. The weight of recycled pulp exported from the U.S. was negligible only a few years ago. With the vast majority of pulp headed for China, it represents a clear reaction to China’s restrictions on imports of unprocessed fiber bales.
U.S. exporters shipped 332,000 short tons of recycled pulp from January through September of this year. That’s up from 283,000 short tons during the same period in 2020, which was up from 206,000 in 2019 and 34,000 in 2018.
This year, 83% of the pulp exports have gone to China, and another 12% went to Canada.
A handful of U.S. mills have announced plans to ship pulp to China in recent years, including Empire Recycled Fiber, Sonoco Products, Phoenix Paper, and others. Most recently, Celadon Development Corporation announced plans to build a plant to recycle OCC and mixed paper into pulp in Georgia.
(Story continues below chart.)
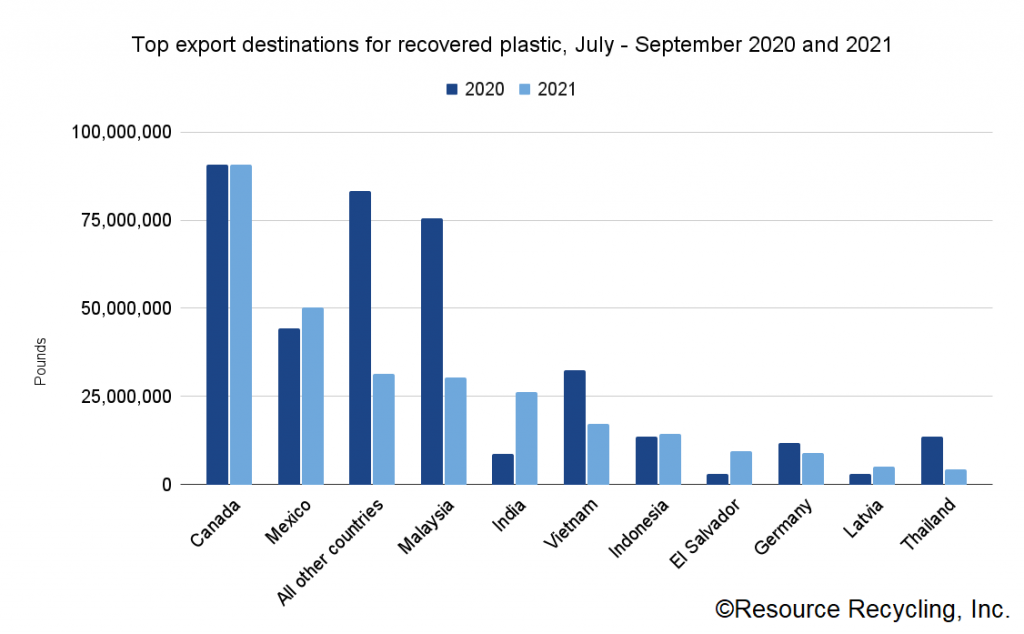
Plastic exports take a tumble
The U.S. exported 288.3 million pounds of scrap plastic during the third quarter. That’s down from 379.8 million pounds during the same period in 2020. It’s also below the 2019 and 2018 weight, continuing an overall downward trend in U.S. scrap plastic exports.
The decrease was driven by a few large importers bringing in significantly less material this year. Plastic exports to Malaysia dropped from 75.6 million pounds in the third quarter of 2020 to 30.4 million pounds during that period this year. Exports to Vietnam dropped by almost half, from 32.5 million pounds to 17.1 million pounds.
The largest importers of U.S. scrap plastic in the third quarter of 2021 were Canada (90.7 million pounds), Mexico (50.2 million), Malaysia (30.4 million), India (26.3 million), Vietnam (17.1 million), Indonesia (14.4 million), El Salvador (9.4 million), Germany (9.0 million), Latvia (5.0 million) and Thailand (4.3 million).
Outside of the top export destinations for scrap plastic, many of the smaller importers brought in less material as well. All combined countries outside of the top 10 importers brought in 31.4 million pounds, down from 83.2 million pounds during the same period in 2020.
A number of factors have contributed to lower scrap plastic exports of late. After China’s import restrictions began slowing exports in 2017, other nations received substantially more material than they had in the past, leading to their own import restrictions. Then, beginning this year, the Basel Convention began regulating scrap plastic shipments globally. The U.S. is not a party to the convention, a fact that has made it more difficult for U.S. exporters to trade the material with Basel-party countries.
The U.S. trade data only reflects shipments that are properly identified in shipping paperwork, and industry stakeholders have previously alleged that some exporters improperly label shipments to get around trade restrictions.