 Scrap plastic shipments from the U.S. declined from 122 million pounds in January to 120 million pounds in February. That February volume was the lowest single month of plastic exports since December 2003.
In addition, February was the lowest month for scrap plastic exports to China since at least 2002, the first year for which figures are available.
By polymer, PE made up 45% of scrap plastic exports. “Other” plastics, the code that’s typically used for mixed-plastic bales, e-plastics and other assorted resins, made up 36%. Scrap PET exports made up 10%. The remainder was small quantities of PVC and PS.
Top export markets for U.S. scrap plastic were India (27 million pounds), Canada (26 million pounds), Hong Kong (11 million pounds), Malaysia (9 million pounds), Mexico (7 million pounds), South Korea (7 million pounds), Thailand (5 million pounds), Taiwan (4 million pounds) and Indonesia (3 million pounds).
(Click chart to view at full size in new browser window.)
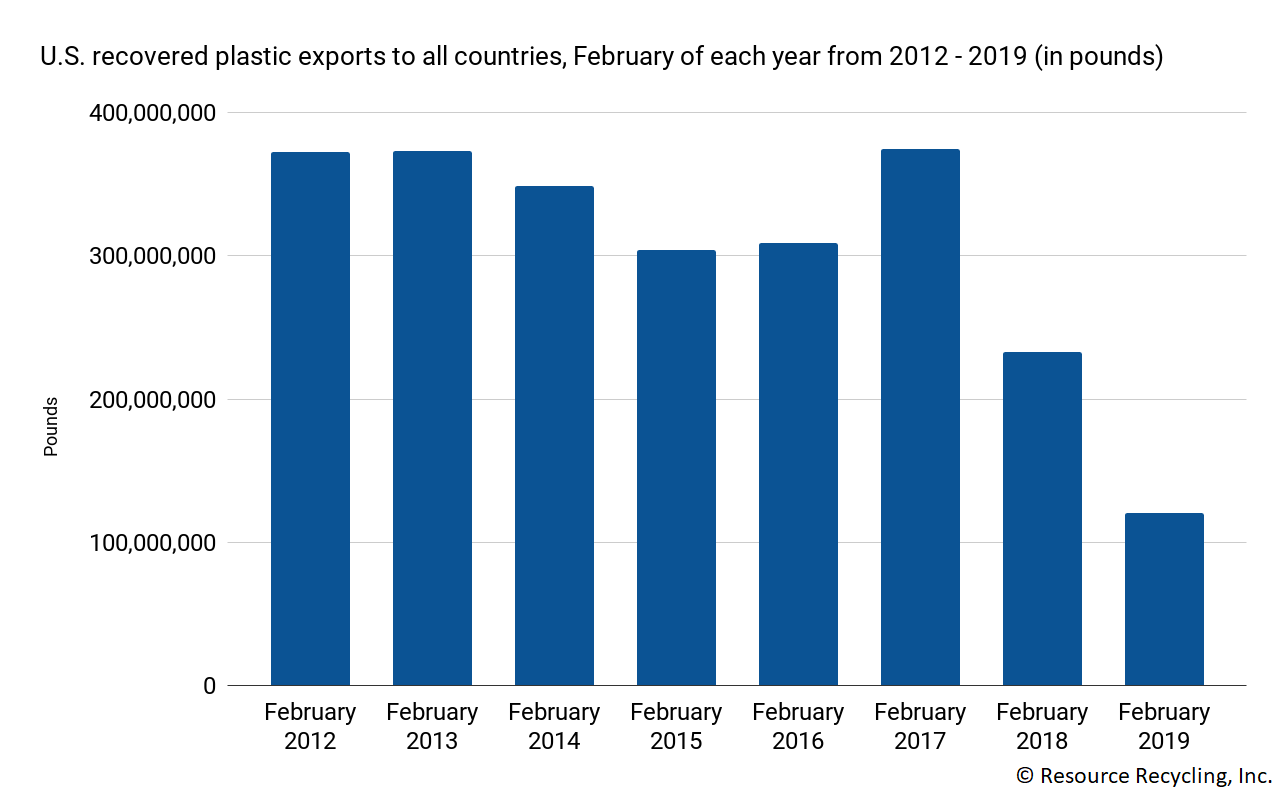
Photo credit: s_oleg/Shutterstock
More stories about exports
- Dow execs talk PE production during bleak earnings call
- Malaysia’s import ban ‘very much up in the air’
- Some tariffs suspended, metal duties spur backlash