

Public and private entities regularly sample waste streams to glean data on the plastics that could be captured for recycling. Now, guidelines have been developed to standardize the process so results can be compared.
The Association of Plastic Recyclers (APR) this week unveiled the best management practices for sorting plastics during waste characterization studies. A Sept. 26 webinar introduced the standards to the industry.
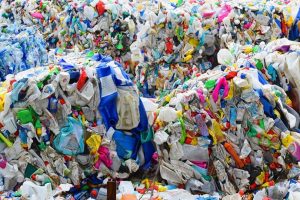
Plastic waste characterization studies involve scooping samples of garbage or recyclables, sorting out the plastics and weighing them. The data helps reclaimers, materials recovery facility (MRF) operators, public recycling programs, state governments and others understand what’s in the plastic stream and how it’s changing over time. For reclaimers, it can also help inform decisions on capital investments to maximize recovery and, thus, revenue.
The problem is not all studies categorize and sort plastic items the same way, making comparisons difficult or impossible. APR’s best management practices are intended to provide standardization.
“What we know is that there’s a loss of clarity when we diverge from standards, so we can’t necessarily compare like items to like items if we’re not calling them and dividing them and sorting them in the same way,” Tonya Randell of More Recycling said during the webinar.
More Recycling conducts industry surveys to gather data for national plastics recycling reports, so the consulting film understands the importance of apples-to-apples comparisons, she said.
“The best management practices help us with better comparisons across the board,” she said.
‘A great idea because it allows consistency’
Liz Bedard of APR and Stacey Luddy of More Recycling took the lead in creating the best management practices, with input from Cascadia Consulting, MSW Consultants, RSE USA, RRS and SCS Global Services. They were developed with support from the American Chemistry Council (ACC).
The effort started a couple of years ago, Bedard said, when APR’s Rigids Committee gathered various waste characterization studies and found the results couldn’t be compared. For example, one study may have sorted PET into eight different subcategories while another used four.
“Without that consistency, without that ability to compare, it was impossible for us to understand trends,” she said.
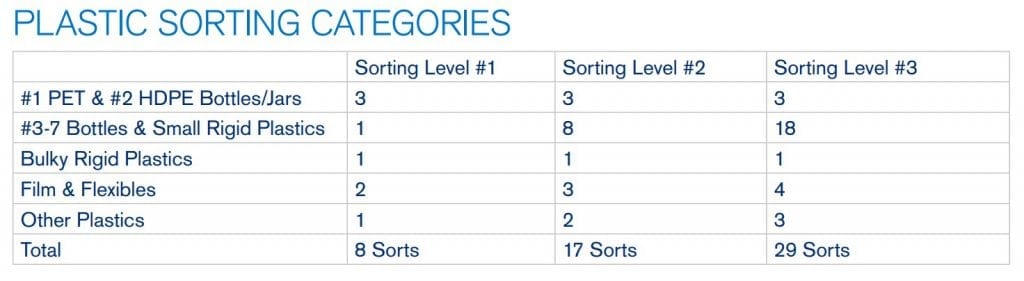
APR’s standards broadly place plastics into five categories: PET and HDPE bottles and jars, Nos. 3-7 bottles and small rigids, bulky rigids, film and flexibles, and other plastics.
Three sorting levels are provided, depending on how extensive a study is desired and how much money is available to pay for it. Level 1 means separating plastics into eight sub-categories, level 2 involves 17, and level 3 involves 29.
“These categories are based on marketable bales,” Bedard said. “We want this to very much be based on reality, what’s happening out there in the real world.”
The number of sub-categories varies. For example, all three levels require separating PET/HDPE into three sub-categories: PET, HDPE natural and HDPE color. “Those are the commodities that are really being pulled out by just about every program in the United States,” Randell said.
But the number of sub-categories jumps substantially in the 3-7s category – from one in level 1 up to 18 in level 3 – simply because of the huge variety of plastics in the 3-7 category.
Stacey Demers of SCS Engineers explained that the more categories you have, the more time it takes and, generally, the more expensive it becomes. Her firm conducts waste characterization studies for municipalities, states, businesses and institutions.
“Every time we do a different study, there’s always a different list of materials. Sometimes they’ve copied it from another study they’ve seen. Sometimes it’s just curiosity. Sometimes they’re not even sure why they have those categories,” she said. “So having … the best management practices put out for the different categories, I think, is a great idea because it allows consistency. It allows material that can fit into categories to help municipalities know the percentage of recyclable plastics that’s in their waste stream and what their program needs to target later on.”
Photo credit: Tunatura/Shutterstock
More stories about industry groups
- Q&A: With EPR incoming, end markets are crucial
- NY legislative session ends, again without EPR
- Major plastic initiative sets sights on system change

