In the course of one year, Los Angeles-area exporters cut their scrap polyethylene shipments to China by 99 percent, leaving thousands of tons of plastic looking for a home. Other countries were only able to absorb about one-fifth of the volume.
Resource Recycling recently analyzed scrap plastics export data from the U.S. Census Bureau, focusing on January numbers from the Los Angeles port district. That district is by far the largest U.S. exporter of scrap plastics, handling material from all over the country brought in on trains and trucks.
In all, scrap plastic exports from the L.A. district fell by more than half in January 2018 year over year. The numbers suggest it was a result of China’s National Sword campaign.
The following is a closer look at year-over-year shifts in the port’s export numbers for specific recovered resins.
A tale of two Januarys
The analysis shows how clearly 2017 was a year of change for scrap plastics exports at the port. Looking at the “before,” nearly 67,130 short tons of scrap plastics left the L.A. district in January 2017. Of that, 52 percent went to China, 37 percent to Hong Kong and 11 percent to the rest of the world.
As 2017 progressed, however, China’s import policies took hold, with the country cracking down on smuggling, issuing tighter quality inspections, decreasing import permits and banning some post-consumer bales.
The effects are seen clearly in the January 2018 data. That month, 30,150 tons of scrap plastics left the port district, a decrease of 55 percent. Of that amount, only 7 percent went to China, 14 percent to Hong Kong and 80 percent to the rest of the world.
Other countries increased their imports, but it wasn’t enough to fully absorb the material that would have otherwise gone to China. Previous analyses by Plastics Recycling Update, sister publication to Resource Recycling, and industry groups have painted the same picture on nationwide basis.
But a deeper look – on a polymer-by-polymer basis – shows some plastics leaving the L.A. area had an easier time finding a new overseas home than others.
Figures compiled by Resource Recycling, Inc.
How different polymers fared
For background, L.A.’s recovered plastics exports were made up of the following in 2017: 39 percent “other” plastic (a category combining PP and No. 7); 34 percent PE, 14 percent PET, 11 percent PVC; and 2 percent PS.
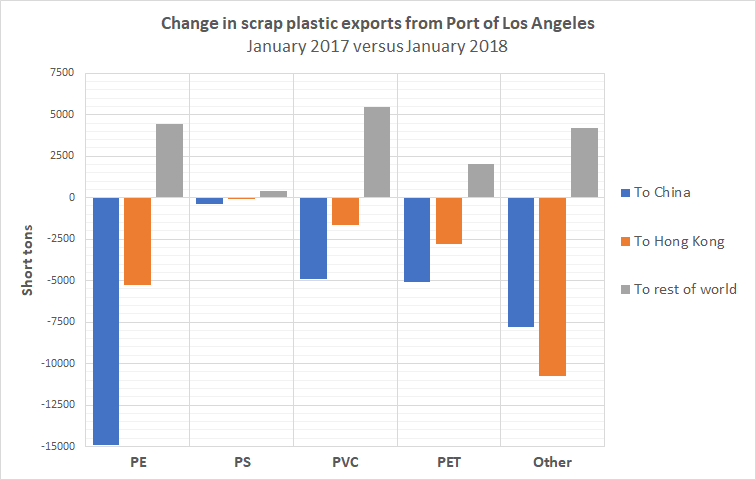
The following shows how different polymers were affected, comparing January 2017 with January 2018:
Other (polypropylene and No. 7 misc. plastics)
- To China: -84%
- To Hong Kong: -84%
- To rest of world: +147%
Polyethylene
- To China: -99%
- To Hong Kong: -83%
- To rest of world: +176%
Polyethylene terephthalate
- To China: -96%
- To Hong Kong: -80%
- To rest of world: +196%
Polyvinyl chloride
- To China: -99%
- To Hong Kong: -84%
- To rest of world: +557%
Polystyrene
- To China: -90%
- To Hong Kong: -100%
- To rest of world: +595%
Finding alternative homes
Comparing January 2017 with January 2018, some polymers had an easier time finding new overseas markets than others. Specifically, the large volume plastics weren’t able to find alternatives as easily as the small volume ones:
For instance, all of the PS tonnages no longer headed to China found alternative foreign homes in January 2018, and 84 percent of the displaced PVC found other homes.
In contrast, only 23 percent of “other” plastics no longer shipped to China and Hong Kong was taken to other countries in January 2018. For PE and PET, 22 percent and 26 percent, respectively, were absorbed by other countries.
Resource Recycling also recently quantified the reduction in Chinese imports from all countries. Global shipments to China roughly mirror the plastic volume drop-off seen by the California port.
Photo credit: trekandshoot/Shutterstock
More stories about exports
- Malaysia fully halting US plastic scrap imports
- Some tariffs suspended, metal duties coming this week
- Tariffs on Canada and Mexico take hold