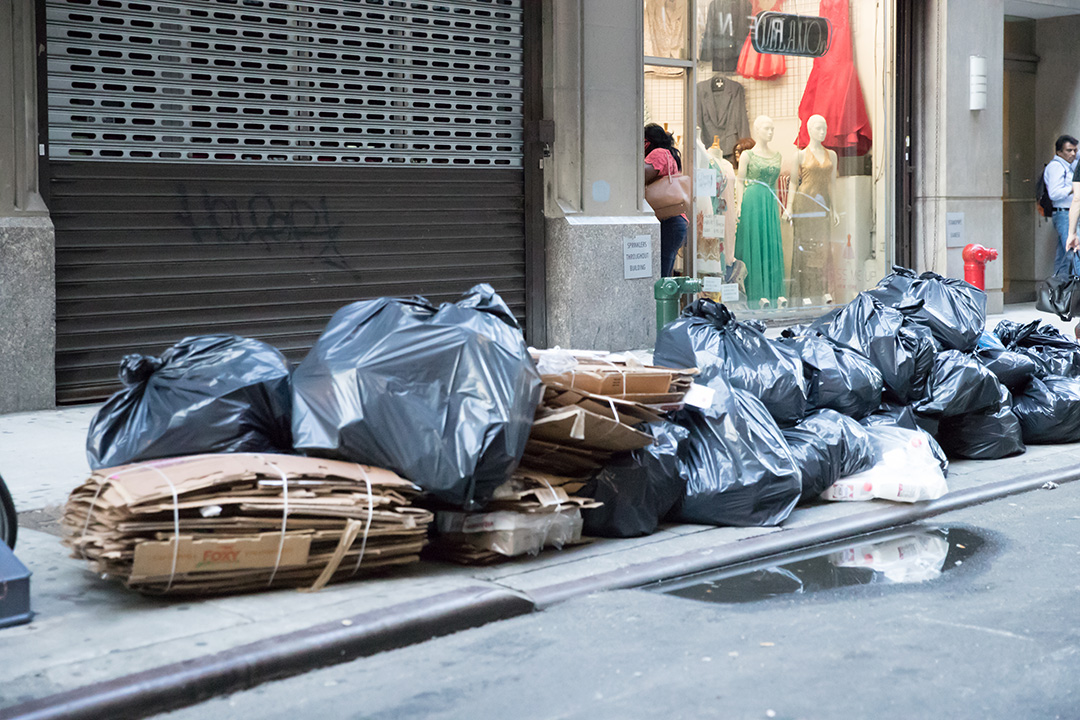
The study, conducted in fall 2022 and spring 2023, sorted samples from residential households, New York City Public Schools, the New York City Housing Authority and on-street litter baskets into 96 main categories. | Helen89/Shutterstock
A waste characterization study in New York City found that recycling rates for metal, glass, plastic and paper declined from previous study years. It also found capture rates decreased and contamination rates increased.
The study, conducted in fall 2022 and spring 2023, sorted samples into 96 main categories and then further into 826 unique material categories. It drew from residential households, New York City Public Schools, the New York City Housing Authority and on-street litter baskets.
It found that in 2023, 75% of New York City residential waste was made of up materials that can be diverted from landfill with currently available sanitation department managed programs and private recycling operations. However, the city’s 2023 diversion rate was 20.2%.
Jessica Tisch, New York City Department of Sanitation commissioner, said in the study that the findings will “provide significant guidance to the next steps of the Trash Revolution.”
“There is new information about the success of universal, easy-to-use composting programs, and actionable information about the relationship between waste generation and density that will be useful in the long-overdue effort to containerize all of New York City’s trash,” Tisch wrote. “In addition, the study found that since bans on expanded polystyrene and plastic shopping bags went into effect, both of these items have declined substantially in the waste stream, validating bans as an effective strategy and lending credence to the fight to enact extended producer responsibility at the state level.”
The last waste characterization study in the city was done in 2017. Since then, New York enacted a statewide ban on most plastic bags and certain expanded polystyrene products. From 2017 to 2023, expanded polystyrene in the stream decreased by 54% by weight, while plastic shopping bags decreased by 67.8%, by weight, from 38.2 pounds per household to 12.3 pounds per household.
Specifically, plastic bags decreased from 1.9% to 0.6% as a percent of all material when compared to 2017, and foam decreased from 0.7% of the stream to 0.3%.
However, in those years, lithium-ion batteries have become “a new, widespread occurrence in the waste stream,” the report noted.
Contamination on the rise
The study found that in 2023, the residential stream was 32% curbside recyclables, 36% organics suitable for composting, 7% other divertable materials and 25% other, which includes construction and demolition debris.
Of the curbside recyclables, 16.6% were metal, glass, plastic and cartons, while 15.8% was clean paper and cardboard. Of the organics suitable for composting: 21.1% were food scraps, 9.0% food-soiled paper and 5.7% was yard waste.
Breaking down the 7% that were other divertable materials, 5.0% were textiles, 0.5% e-scrap, 0.6% plastic shopping bags and 0.4% harmful household products.
The final quarter of the residential stream are non-divertible other items, including “diapers, foam, garden hoses and different types of film plastics,” the study noted.
On a per household basis, annual generation of all aggregate material is down to 1,899 pounds in 2023, compared to 1,988 pounds in 2017.
Paper contamination rates increased by an average of 1.9% between study periods since 2005, but increased by 6% between 2017 and 2023, the study found.
“Rates of contamination in 2023 are higher than in 2013, when all rigid plastics were not designated as recyclable,” the study noted. “Despite designating more plastic categories as recyclable in 2023, the contamination rate in MGP recycling – including organic material, paper, and non-recyclable film plastic – has increased to 27.5% in 2023 from 18.7% in 2017.”
The 2023 study also included a data breakdown by density and income, finding that higher income areas tended to recycle more and higher density areas tended to generate less material.
Fiber capture rate reverses longtime trend
Delving into capture rates by material type, both the amount of clean paper and cardboard generated and collected has decreased since 2017. Further, 2023 was the first year in which paper capture rates declined since measurements began in 2005.
In 2005 the clean paper and OCC capture rate was 45.8%, growing to 46.8% in 2013 and 51.3% in 2017 before falling in 2023 to 48.8%.
The capture rate for metal, glass and plastic in 2023 was 40.9%, down from 43.5% in 2017. In 2005 and 2013, the capture rates were 44.3% and 47.4%, respectively, though those years did not include non-bottle rigid plastics.
Broken out by specific material, in 2023 the capture rate for HDPE colored bottles was 57.9% and HDPE natural bottles came in at 54.7%. Clear and green PET bottles were captured at a rate of 39.3%, while all other PET bottle colors were captured at 46.7%. Other resin type bottles were captured at a rate of 35.8%.
The 2023 rate for thermoforms was 31.9%, and about 9.7% of single-use plastics were captured. Beverage cartons and aseptic boxes had a rate of 35.5%, while aluminum cans and bottles came in with a rate of 25.5%.
Glass capture rates in 2023 were 53.3% for clear container glass; 47.8% for brown container glass; 57.7% for other color container glass and 27.7% for other glass in general.

