

This article originally appeared in the November 2018 issue of Resource Recycling. Subscribe today for access to all print content.
Last month, we presented the first section of a two-part article outlining results from a longitudinal study assessing the evolution of resident knowledge in the city of Bellevue, Wash. when it comes to recovery options for a variety of household hazardous materials.
The unique analysis relies on a highly refined survey of a representative segment of residents, and that survey has been issued every two years since 2006. This process offers a data set showing how attitudes and actions have shifted over the course of a decade, and the findings are particularly noteworthy because during the time of the study producer responsibility initiatives have been introduced for a number of relevant materials. The longitudinal study, therefore, has helped show how effective these programs have been in terms of informing the Bellevue audience.
Last month we outlined the findings for two material categories: used motor oil and fluorescent lighting bulbs and tubes. This month, we continue the discussion with a look at research results around electronics, rechargeable batteries, paint and medications.
We also outline some of the specific considerations other municipalities and stakeholders need to keep in mind if they decide to undertake similar studies.
Electronics
Any discussion of electronics collection in Washington must start by noting the state’s groundbreaking producer responsibility law for managing end-of-life consumer material.
Signed into law in March 2006 with collection beginning in January 2009, the E-Cycle Washington Program initially covered televisions, monitors, computers and laptops. In recent years, tablets, e-readers and DVD players have been added to the list of covered items. The program operates with no visible cost to individuals bringing accepted equipment to registered collection sites. Program costs are covered by electronics producers.
Bellevue provides limited support and outreach to electronic take-back locations, but the city offers single-family, curbside collection of computers, computer equipment and small electronics and appliances. This service is funded through the general garbage and recycling collection rates (there is no per-use fee to residents, though users must call the hauler in advance to arrange pick-up).
The city’s survey, conducted with assistance from Elway research, has asked a number of e-scrap-related questions in the time the state’s collection program has been in place.
As noted above, program implementation began in 2009, and in the 2010 poll, 43 percent of respondents indicated they had heard of the state’s producer responsibility program for select electronics. By 2012, the percentage dropped to 33 percent before rising slightly to 39 percent in 2014 and dropping again to 36 percent in 2016. This may be reflective of the level of program promotion at both the state and city level, and it could be an indicator that refreshed outreach and education efforts are needed.
Another survey question has asked whether respondents who had heard of the program had actually used the take-back option. According to the survey, 37 percent had used the program either once, twice or more than twice in 2010, shortly after the program began. By 2012, that number rose to 40 percent, and by 2014 the combined figure was 43 percent. In 2016 the figure was 52 percent. This trend indicates that while fewer people report having heard of the program over the years (as noted above), among those who have heard of the program, an increasing number are taking advantage of it.
The survey also explored the quantity of electronics residents report having in their homes. Respondents were asked whether they have computers, computer monitors, or televisions that they no longer use and are ready to get rid of. They were also asked how many of these devices they have on hand.
No particularly strong trend lines are visible in the data, with the exception of the number of respondents reporting they have no old computers in storage.
Surprisingly, this number floated downward from 70 percent and 72 percent in 2006 and 2008, respectively, to 61 percent in both 2014 and 2016.
The percentages of respondents noting they had one, two, three, four or five-plus old computers stowed away did not change in a consistent direction. This could mean the individuals who were looking for a recycling option took advantage of the program over time but that many have simply continued to horde unwanted computers.
In the televisions category, the number of respondents reporting they were storing zero unwanted units bounced up and down between 79 percent and 82 percent from 2006 to 2014, and then jumped up to 85 percent in 2016. Similarly, the number of respondents reporting they have one end-of-life unit stored dropped to 9 percent in 2016 after staying between 12 percent and 16 percent from 2008 to 2014.
Such an interpretation is roughly corroborated by the results of a question asked between 2012 and 2016 of respondents who affirmed participation in the electronics take-back program. Those individuals were asked, “What devices did you recycle?” The percentage of respondents saying they recycled old style televisions dropped between 2012 and 2016 from 43 percent to 19 percent; meanwhile, the percentage for flat screen TVs increased from 4 percent to 14 percent.
The percentage of people who noted they had recycled computers dropped in the same time period from 59 percent to 44 percent. Laptops and monitors held essentially steady.
With regard to storing and hording of unwanted computers – the very backlog the state’s collection program is intended to diminish – the survey results are mixed.
Overall, the percentage of respondents indicating they had between one and five computers at home that they “no longer use and are ready to get rid of” fell from 31 percent in 2006 to 29 percent in 2016. That’s not nearly as big a drop as program planners would like to see.
When analyzing the data, one sees that reports of having five or four computers at home stayed essentially the same. But there does seem to be progress when it comes to the percentage of people reporting having two or three old computers in storage – that number dropped to an all-time low in 2016. And reports of having only one unwanted computer in storage actually rose between 2006 and 2016. Taken together, these figures could serve as an indication that residents are indeed getting rid of the backlog of stored computers, even though many still have at least one stowed away.
Looking at respondents who had to dispose of televisions, the percentage stating they would typically use an “electronics recycler” rose steadily from 5 percent to 17 percent between 2006 and 2016; the percentage responding “charity” rose during the same period from 13 percent to 21 percent. The “curbside” response began at 11 percent in 2006, rose to 14 percent in 2010 and dropped to 7 percent by 2016. In general, these findings imply growth in awareness that electronics should be properly managed at end-of-life.
Rechargeable batteries
Rechargeable batteries, from power tools and increasingly from AA and AAA applications, are key targets for the national, industry-funded, voluntary producer responsibility Call2Recycle program. Bellevue leverages this program by promoting and supporting existing collection locations and by working to expand the number of sites within the city. However, the city has not developed an ongoing retailer support program for rechargeable battery collection the way it has for other products, such as used motor oil.
The one exception was a 2014 partnership with Call2Recycle for which the city recruited retail collection sites that offered discounts and rewards for residential participants bringing in rechargeable batteries (one example: a hardware store that offered 20 percent off all rechargeable batteries when old ones were brought in).
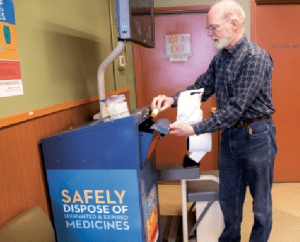
Bellevue, Wash. has been covered by a county-wide medicine return program since early 2017. The city’s outreach survey has worked to determine the effectiveness of messaging around the effort.
During the time of the program, Call2Recycle monitored return data at their branded collection sites in the city. Distinct growth in the number of returned batteries and cell phones was visible, but it would be hard to assign sole credit to the city’s program, given other simultaneous regional recycling education efforts regarding rechargeable batteries and cell phones.
The survey data on rechargeable batteries was less conclusive. In 2006, the percentage of respondents saying they typically use the trash when needing to dispose of rechargeable batteries was 17 percent, but that rose to 20 percent in 2008. The number dropped to 14 percent in 2010, and dropped further to 13 percent in 2012 and 12 percent in 2016. However, in 2014, the year of the Call2Recycle partnership program, the percentage bumped up to 18 percent, making it hard to draw conclusions about trends or program impact.
Perhaps a more reliable indicator of improving disposal habits is the steady rise of respondents stating they would take their rechargeable batteries to a retail store.
That number was 2 percent in 2006 and grew to 7 percent in 2016. Also of interest, though hardly conclusive, is the percentage of respondents saying they would bring their unwanted rechargeable batteries to an electronics recycler – this number stayed essentially flat (4 to 5 percent) between 2006 and 2016.
In comparison to the apparent growth in program participation for mercury-containing lighting (described last month), the rechargeable battery numbers have lagged – and outreach may explain the disparity between those two programs. While numerous rechargeable battery collection sites exist (thanks in large part to Call2Recycle), neither Call2Recycle nor the city engaged in a lengthy, widespread promotion and education campaign beyond the brief coupon and discount program described above. This differs greatly from the mercury-containing lighting effort, which enjoyed a consistent regional education effort.
Medications
In Bellevue, as in most jurisdictions across the country, take-back programs for unwanted medications (name-brand prescription, generic prescription, and over-the-counter) have been a long time coming. Drug and pharmaceutical producers have been generally absent and oppositional when it comes to actively collecting unwanted medications. In the absence of manufacturer support, or concerted action on the state and federal level, local jurisdictions have stepped in to address the risks associated with unwanted medications (including theft, overdose, accidental poisonings of seniors and children, and environmental harm from improper disposal), with a number of local governments passing ordinances that require drug producers to establish secure medicine return programs.
Bellevue is covered by one such ordinance, passed by the Seattle-King County Public Health Department. Following several years of a groundbreaking local voluntary pilot, the Board of Health adopted regulations in June 2013 and the collection program began in January 2017. The county-wide secure medicine return system is overseen by MED-Project, a stewardship organization working on behalf of over 410 drug manufacturers. (Notably, the state of Washington this spring passed the nation’s first statewide producer responsibility law for pharmaceuticals, based in large part on the several county-level ordinances passed within the state.)
For nearly a decade Bellevue and its consultant staff have reached out to the city’s pharmacy community to encourage participation in the original collection pilots.
The have also recruited participation in the legislated producer program that encourages voluntary participation by pharmacies.
Beginning in 2010 the survey began asking residents the question “What do you typically do with leftover, expired or unwanted medications?” During the four survey cycles between 2010 and 2016, little clear motion in a specific direction was observed among any of the response options. “Keep them in a cabinet” accounted for a low of 13 percent and a high of 18 percent of responses over the six-year period. “Put them in the trash” ranged from 32 to 26 percent. “Take them back to a pharmacy” floated from 17 percent in 2010 to 22 percent in 2012 and 2014, before sinking to 18 percent in 2016.
An encouraging indicator is that the “Flush them down the toilet or sink” response floated up from 14 percent to 16 percent between 2010 and 2012 before dropping to 10 percent two years later and then to 8 percent in 2016. We can hope that this positive trend was a result of regional education regarding proper disposal of medications associated with the pilot program and the launch of the producer responsibility program.
How likely are residents to take unwanted medications to a pharmacy? The response “very likely” rose from 40 percent to 43 percent between 2010 and 2012, dropped to 27 percent in 2012, and rose to 32 percent in 2016. Meanwhile, the response “very unlikely” rose continuously from 2010 through 2012 to 2014, hitting a high of 34 percent before dropping to 21 percent in 2016. The City hopes to see this number continue to fall in 2018.
Are we trendy?
If you connect any two data points you have a trend line, but you don’t necessarily have a trend. Ten years of data, however, provides tremendous value and insight.
Each year, program planning time inexorably rolls around again, and the city of Bellevue and its consultant team must take action, even in the absence of perfect information or conclusive findings. Such is the relationship between data, theory and practice. In this context, the intuitive direction derived from interpreting the survey results allows the city to document actions (such as public awareness of the hazards of CFLs), identify program gaps (such as weak awareness of rechargeable battery recycling options), and chart a path forward.
The survey can also provide best-available estimates of pivotal data points necessary when developing recovery rates of critical materials like used motor oil. For example, when estimating how much used oil might be available from DIY oil changers in a community, the percentage of DIYers is a critical factor in any calculation, and should be determined as carefully as possible (and when possible, be based on local conditions rather than national estimates). The tracking surveys allow the city of Bellevue to do just that.
Further analysis of a different order may be possible by drawing upon the substantial demographic and cross-tab data available from each year’s survey. Information on age, education level, gender, income and more is gathered with each fielding and can be cross-referenced with other program findings.
Of course, statistical validity drops as sample sizes drop, so caution is due. Findings drawn from the entire survey population are stronger than findings drawn from subsets. In other words, we can be more certain of the percentage of respondents who have a DIY oil changer in their house than we can of the percentage of females with graduate degrees and comparatively low incomes who have four old computers in storage. That being said, breaking down some response categories by age, gender or other factors could be provisionally instructive when trying to answer certain programmatic questions or crafting targeted messaging.
Regarding single-variable demographic data, it appears that the survey group remained generally stable over the 10 years of survey implementation. Age groupings held essentially steady, with a bit of decline over time in the 65-plus age bracket. In terms of education levels, a slight percentage drop was seen in those reporting a high school-only education, and a slight increase occurred in reports of graduate degrees. There were no remarkable changes in response categories for people per household, dwelling type, gender or income.
We also observed a statistically significant increase in residents stating they would turn first to the city’s website if they wanted to reuse or recycle a product that could not be managed through their curbside program. That number went from 18 percent in 2010 to 29 percent in 2016.
The longitudinal information we have gathered provides best-available data, informs program evaluation and guides decision-making and program course-correction. It’s true the survey information does not always point in one clear direction, but having the numbers on hand certainly beats the alternative: flying completely blind.
Stay tuned to hear what we learn in 2018.
Jennifer Goodhart is the conservation and outreach program administrator at the city of Bellevue and can be contacted at [email protected]. David Stitzhal is president of Full Circle Environmental, Inc. and can be contacted at [email protected]. Please contact the authors for copies of each year’s survey and the top-line results. The authors also offer deep thanks to Stuart Elway, president of Elway Research, Inc.