


This article originally appeared in the October 2018 issue of Resource Recycling. Subscribe today for access to all print content.
The municipal recycling sector is no stranger to studies. Many municipalities, for instance, have undertaken analysis of the local materials stream via waste characterization research. It’s also become common practice to delve into the specifics about how often residents are placing their carts at the curb or what portion of a population knows about a particular service offering.
However, the notion of longitudinal research is less common in the industry. In this type of analysis, the same community or set of individuals is studied over an extended period of time. Such studies of course require a longer term commitment on the part of organizers and don’t necessarily produce results that can be immediately leveraged, but they bring tremendous value by plotting trend lines based on hard numbers.
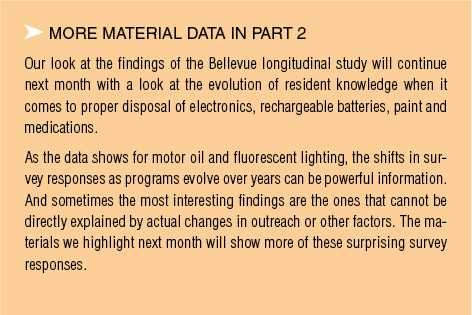
In a two-part article that starts here and will conclude next month, we’ll outline the details around a longitudinal study focused on recovery of used oil and household hazardous waste in the city of Bellevue, Wash.
The research demonstrates how residents’ attitudes and behaviors in different material categories have evolved as outreach and collection systems have been implemented. The story will also offer some discussion on how consistent surveying of recycling outreach audiences over the course of years can offer recycling coordinators a more holistic system of guidance for making program decisions.
Long history of hazardous waste education
Bellevue is Washington’s fifth-largest municipality, with 141,400 residents, and it has had a robust resource conservation outreach and education program reaching back to the early 1990s.
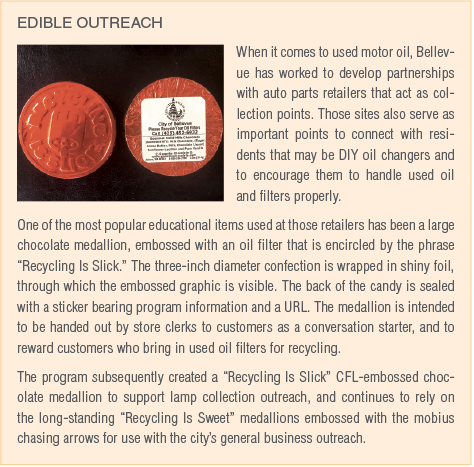
A pillar of these efforts has been the Used Oil and Household Hazardous Waste Education and Assistance Program. The effort divides its focus between educating the public about proper management and disposal of household hazardous materials and working directly with retail partners.
The city has targeted numerous household hazardous materials over the years, including used motor oil, used oil filters, fluorescent lighting (CFLs and tubes), rechargeable batteries, latex paint, electronics and pharmaceuticals.
To get a firm handle on metrics relevant to the program, the city has for more than a decade contracted with polling and survey firm Elway Research to field a statistically representative survey of Bellevue residents. Initiated in 2006 and fielded every other year, the survey has now been run six times.
During this period, a number of significant policies relating to the collection of household hazardous materials have been implemented, including the state’s landmark extended producer responsibility law for electronics (passed in 2006), the state’s fluorescent lamp take-back law (launched in 2015), and the Seattle-King County pharmaceutical take-back program (passed in 2013).
Analysis of Bellevue’s survey data from the past decade helps to highlight how those programs and other locally focused efforts have affected behavior among residents. The systematic approach employed by survey organizers has allowed year-over-year comparisons among the responses to specific questions, which in turn has provided valuable indicators pointing toward which program elements are proving effective and which are perhaps falling short.
 In order to generate longitudinally informative data, the wording of survey questions has been kept consistent whenever possible, and the same questions are fielded with each survey. To further assure the data’s veracity, rigorous survey techniques are deployed, including the use of open-ended questions and randomized ordering of response prompts.
In other words, the survey, in addition to being carefully constructed to generate statistically reliable results within a given year, can also offer predictability and significance when comparing data across years. Note, however, that some trend lines are more robust than others and the observations, conjectures, conclusions and recommendations summarized herein should be thought of more as helpful signs guiding the city’s program forward, rather than as explicit directions dictating a specific path.
Motor oil and filters
The City’s retail partnership approach is perhaps seen most clearly in Bellevue’s long-running work with major auto parts stores in the city. Such retailers are on the front lines of receiving used oil and other materials from the public, and they often find themselves at a loss of how to respond to specific customer questions, particularly for auto-related fluids that the retailers don’t accept for recycling.
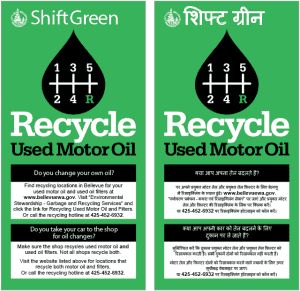
The city provides a variety of materials for retailers to share with their customers about proper recycling and disposal of automotive-related materials. Program staff members also help the businesses deal with collection, recycling and disposal issues, and they actively promote throughout the city those retail sites that accept used motor oil and filters from the public. Additionally, city employees provide support with instances of illegal dumping and other programmatic issues.
A core component of the city’s used oil program is estimating a recycling rate for do-it-yourself motor oil changes each year. This calculation is made by dividing the amount of used oil generated each year by DIYers (denominator) into the amount of used DIY oil collected throughout the city (numerator). A key factor in estimating the generation number is the estimated percent of Bellevue residents that actually change their own motor oil and therefore generate used oil available for collection. Getting a handle on this critical factor – the DIY rate – is one of the primary reasons the city initiated the Elway Research survey in 2006.
The DIY percentage figure ascertained by the survey is combined with other used oil generation and collection data and plugged into a custom model that estimates the DIY used oil recycling rate – this also provides the city with an assessment of how much used oil might be improperly disposed. The higher the percentage of respondents who bring their car in for oil changes, the lower the volume of used oil generated by DIYers requiring proper collection for recycling. (The city’s model, and a detailed analysis of the model’s results, are discussed in detail in the following peer-reviewed article: Environmental Practice 3 (2) June, 2001; p.114. “Estimating Used Motor Oil Volumes Generated by Do-it-Yourself Oil Changers in Bellevue, Washington,” Stitzhal, D. and Holmes, D.)
In the inaugural 2006 survey, 66 percent of respondents stated they always have their cars’ oil changed at a shop, rather than changing their own oil. In the ensuing years, that number increased and has held fairly steady around the 83 percent number tabulated in 2016 (the most recent year the survey has been undertaken).
Meanwhile, the percentage of DIY respondents stating they “took their used oil somewhere for recycling” went from 59 percent in 2006 to a high of 87 percent in 2012 before settling back to 65 percent in 2014 and 68 percent in 2016. This provides at least some evidence that the number of DIYers aware of and using used oil collection sites is increasing.
Correspondingly, the percentage of DIYers reporting they put their used oil in the trash began at 10 percent in 2006, dropped to between 3 and 6 percent from 2008 to 2014, and then inexplicably rose again in 2016 to 11 percent. Fortunately, the percentage of DIYers reporting they took their used oil to either a gas station or an auto parts store rose from a 2006 low of 39 percent to a high of 75 percent in 2016.
Fluorescent lighting
The survey process has also investigated resident attitudes and behavior when it comes to disposing of fluorescent lights, a material type that needs to be handled as a separate stream due to mercury exposure issues.
In what may be an indication of growing public awareness that compact fluorescent lights should be handled in a specific manner, the percentage of respondents who felt that hazardous waste handling procedures “don’t apply” for fluorescent tubes dropped from 45 percent in 2006 to 20 percent in 2016.
In addition, the percentage of respondents noting they typically dispose of lights by returning them to a store began at 3 percent in 2006 and by 2016 had risen to 11 percent.
A similar trend was observed for fluorescent tube disposal. The option of “returning to a store” was reported by 3 percent of respondents in 2006 and hit 11 percent in 2016. (Somewhat contradictorily, the percentage who reported “trash” as a method they typically use for CFL disposal registered at 18 percent in 2006, rose to 25 percent in 2014 and dropped in 2016 to 19 percent.)
It is particularly interesting to view the above results through the lens of implementation of Washington’s LightRecycle take-back program. This legislated initiative launched statewide at the start of 2015, at which time an “environmental handling charge” began to appear on all receipts for mercury-containing lighting sold in the state.
At the same time, a network of predominantly retail take-back locations began accepting up to 10 CFLs or tubes from each customer daily. Shortly thereafter, in April, a digital marketing campaign was launched, and in the fall of 2015 a print campaign began. In 2016, similar digital and print campaigns were executed.
This program rollout preceded by more than a year the 2016 survey that assessed residential behaviors and beliefs in Bellevue. The bump in awareness that lighting can be a hazardous-waste concern and the growth among respondents reporting retail stores as their typical disposal option seem likely to be related to the launch of the statewide program and outreach campaign.
The Elway survey further assessed public awareness of mercury issues from a different angle by asking respondents “how likely, to the best of their knowledge,” a number of products were to contain mercury. Products included thermostats, cell phones, fluorescent bulbs, fluorescent tubes, car trunk switch lights, toasters and computers. A seeming trend of growing awareness emerged in a number of results.
For example, for CFLs, the percentage of respondents stating that to the best of their knowledge the bulbs “definitely” contain mercury rose from 10 percent to 29 percent between 2006 and 2016. The portion responding “probably” rose from 26 percent to 30 percent. Respondents declaring “definitely not” held essentially steady over the same period, dropping from 10 percent in 2006 to 6 percent in 2012 before rising to 9 percent in 2016.
 Significantly, the percentage of respondents stating they would return unwanted bulbs to a retail store started at 3 percent in 2006, bounced as low as 1 percent and as high as 5 percent through 2014, and then saw a jump to 11 percent in 2016. (A similar trend was seen in the responses regarding fluorescent tubes.)
The data for the CFLs and fluorescent tubes will be particularly interesting to track in 2018 and beyond, given the way the backdrop legislation for LightRecycle is structured.
The program is funded through an environmental handling charge calculated on a per bulb basis. The amount of that charge has already been raised once, but overall sales continue to plummet in response to the growing popularity and affordability of LEDs, resulting in a commensurate drop in LightRecycle program revenue. However, end-of-life bulbs continue to pour in for collection, with anecdotal evidence from retailers indicating that the long life and big backlog of CFLs will keep collection rates – and therefore program costs – at current levels for some time, despite dropping program revenues.
Jennifer Goodhart is the conservation and outreach program administrator at the city of Bellevue and can be contacted at [email protected]. David Stitzhal is president of Full Circle Environmental, Inc. and can be contacted at [email protected].
Please contact the authors for copies of each year’s survey and the top-line results. Also available is an expanded version of this article, with more complete data, program descriptions and findings. The authors also offer deep thanks to Stuart Elway, president of Elway Research, Inc.