


This story originally appeared in the February 2017 issue of Resource Recycling.
Subscribe today for access to all print content.
“If you build it, they will come.” Over the years, this classic line from “Field of Dreams” has been applied to business thinking again and again.
And when it comes to recycling, the “build it” mantra has in many ways summed up the industry’s strategy over the last 25 years. The thinking among policymakers is that if you provide access to recycling, people will recycle.
But unfortunately, while this concept may have worked for a fictitious Iowa farmer, it’s simply not sufficient when the goal is robust municipal materials recovery.
One only needs to consider U.S. packaging recycling rates as they compare to U.S. recycling access rates to see clearly that as the material stream has shifted, increased access has not resulted in high levels of packaging diversion.
Producers’ push for 60 percent
In February 2014, I wrote an article for Resource Recycling that explored all of the work done to determine levels of recycling access in America. At the time, it was an important issue for brandowners selling products into the U.S. market, since labeling a package as “recyclable” requires that at least 60 percent of U.S. residents have access to recycling the packaging material in question. That stipulation is part of the U.S. Federal Trade Commission’s guidance for environmental marketing claims.
Since then, the industry has seen a two-year intensive study on the subject spearheaded by the Sustainable Packaging Coalition (SPC), an industry group dedicated to a more robust environmental vision for packaging. The Centralized Study on Availability of Recycling aimed to determine the scope of recycling programs in the U.S. and the acceptance of different types of packaging. The final report based on the research was released in summer 2016 and is by far the most comprehensive and rigorous study on recycling access done to date.
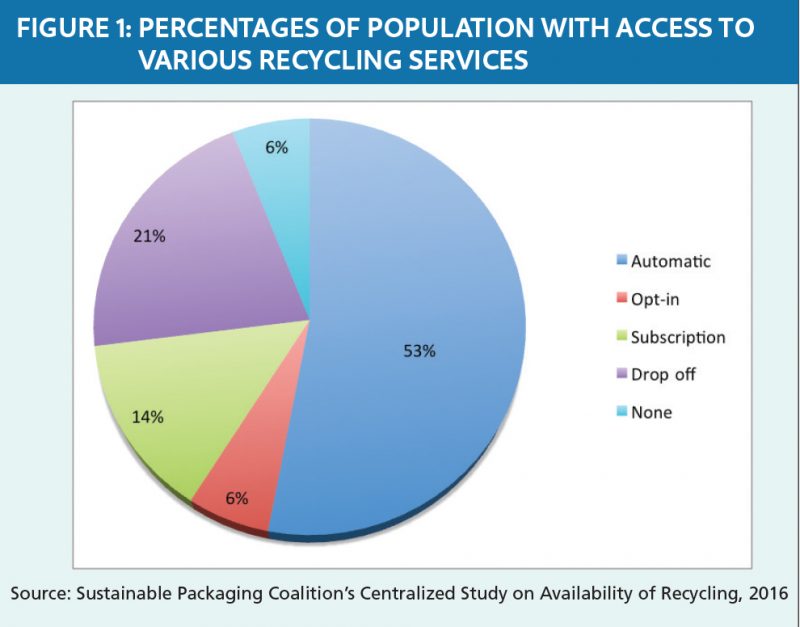
Consistent with previous research, the study revealed that the vast majority (94 percent) of Americans have access to some sort of recycling. Perhaps more importantly, it identified American access percentages for different types of recycling programs. The study broke down the nation’s municipal recycling systems into the following categories:
- Automatic: Residents receive recycling services, including bins or carts, by default as part of standard waste collection services.
- Opt-in: Residents must sign up for recycling collection (and, in some cases, pay an additional fee).
- Subscription: Residents hire and pay for curbside recycling services on an individual basis from their choice of private service providers.
- Drop off: Residents bring recyclables to a collection point away from their residence.
See Figure 1 for a look at the prevalence of each of those collection paradigms, according to the SPC report.
If American access to recycling is 94 percent overall and if that number is considered the primary determinant of recycling rates, we should expect the recycling rate for items normally collected in curbside and drop-off programs to at least be moving toward that 94 percent. As the industry knows all too well, however, that is not the case.
The national recycling and composting rate reported by the U.S. Environmental Protection Agency for 2014 was 34.6 percent. But that number includes many material types not suited for municipal recycling systems, so it’s not the best figure to use when assessing efficacy in terms of access.
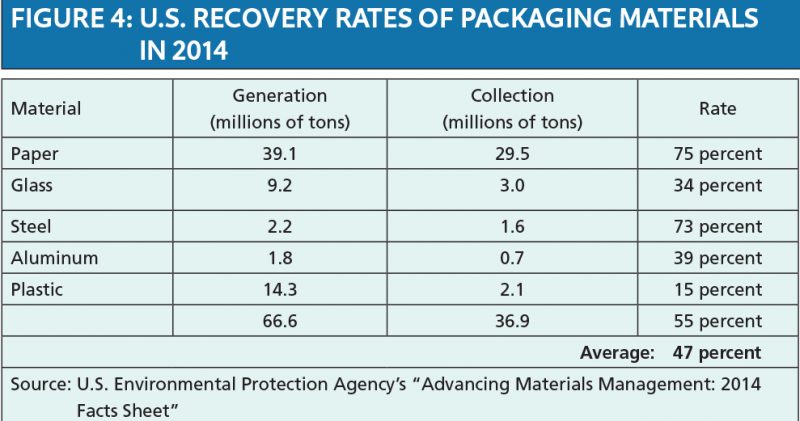
A better recovery rate to use here is 55 percent. That’s the recovery figure the 2014 EPA report indicates for containers and packaging. We determined this number by using data in the EPA’s “Advancing Materials Management: 2014 Facts Sheet.” Generation and recovery numbers for the containers and packaging category are provided in Table 2 of the EPA report, and the numbers on wood were left out of our calculation because that material is not commonly collected in recycling programs.
 The key role of program participation
All that is to say that 94 percent of American households have access to recycling, but just 55 percent of materials typically accepted in those systems actually get recovered. Why is this happening?
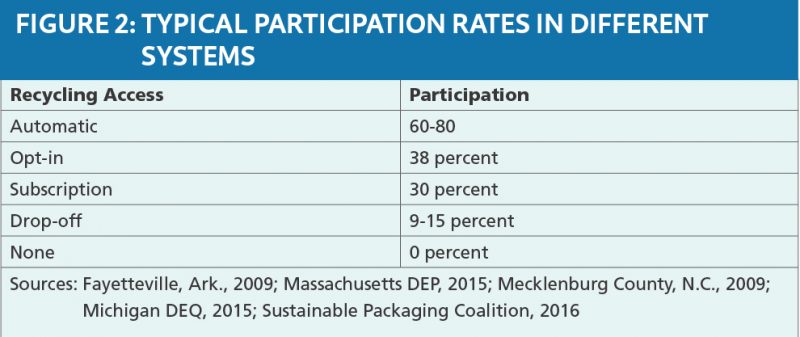
The simple answer is that recycling rates are affected not only by access but also by participation. While previous studies have looked at participation, the SPC study is the first to show participation rates and how they correspond with different modes of access, including opt-in and subscription. When this information is combined with data from other participation studies, one can gain a better understanding of how participation in recycling depends, to some extent, on convenience.
Participation, not surprisingly, is higher in automatic systems and lower in drop-off systems.
Based on the SPC study and extrapolations from other studies, we can determine ranges of participation rates in the various types of recycling programs (see Figure 2). The 38 percent participation statistic for opt-in programs and the 30 percent number for subscription both come from the recent SPC study. The other numbers in the chart are based on analysis of participation studies over the past eight years in Arkansas, Massachusetts, Michigan and North Carolina. Those research efforts found participation rates in automatic systems in the range of 60 to 80 percent and drop-off participation in the range of 9 to 15 percent.
With this new information, we can better determine how several key variables come together to influence recycling effectiveness. To start, let’s define a community’s access rate as the percentage of people with access to a particular method of recycling. And the participation rate is the percentage of people with access to a particular method of recycling who choose to use it.
Along with those two numbers, programs will have something called a recycling accuracy rate. This number is the percentage of available recyclable material that is actually recycled by an individual, and it reflects the reality that not everyone that has access to and participates in a recycling program recycles 100 percent of his or her recyclable products. For example, an individual who drinks 10 cans of soda but only recycles nine of them would have a 90 percent recycling accuracy rate for that specific packaging type.
Using the rates detailed above, we can estimate what a community’s overall recycling performance rate will be using the following formula: access times participation times accuracy equals recycling performance rate.
 Finding the limits to success
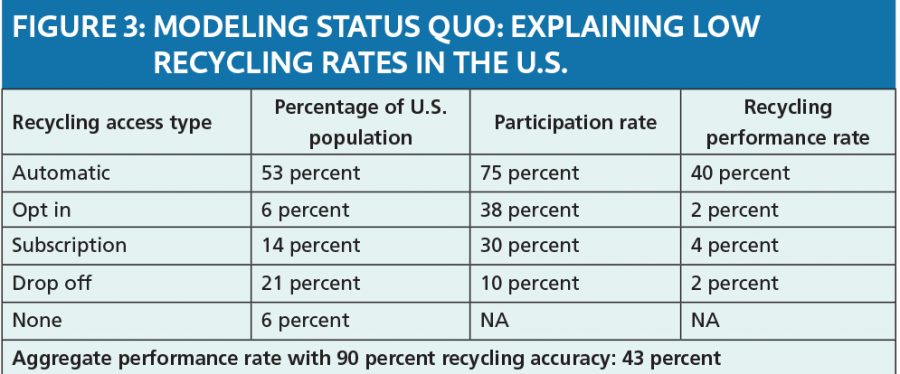
The recycling performance rate formula, along with the data from the SPC study as well as others, can provide valuable guidance in terms of where to focus our efforts and where lie the limits to success.
Figure 3 shows estimates, derived using the formula detailed above, for the recycling performance rates that can be expected from different modes of access – these estimates assume a high level of recycling accuracy (90 percent) on the part of users. The percentages of the population with each type of recycling access come from the SPC study. For recycling participation rates, we used the opt-in and subscription rates detailed in the SPC studies and applied rounded-off participation rates of 75 percent for automatic service and 10 percent for drop-off programs.
This 43 percent rate shown at the bottom of figure 3 represents a combined performance rate and does not take into account the fact that different packaging types have different rates, nor does it consider the impact of their relative weights. For these reasons, it cannot be compared directly to the 55 percent rate for the packaging and containers categories that was derived from the 2014 EPA report.
This occurs because the 55 percent number represents total collection in weight (36.8 million tons) over total generation (66.6 million tons). The fact that 75 percent of that amount (27.0 million tons) was paper and paperboard (OCC and newsprint, for example), which are materials with high recycling rates, obscures the picture when we are only interested in examining actual performance rates. Furthermore, the high recycling rates for paper and paperboard reported by EPA include commercial recycling, which typically shows extremely high capture rates for paper and paperboard.
Given today’s ever-evolving mix of packaging materials, combined weight-based recycling rates do not offer the important information needed when attempting to achieve greater system performance for all materials, irrespective of their density.
But when you consider the EPA’s numbers by packaging type and look at the average of those rates, the collection rate is 47 percent, which is fairly close to the 43 percent estimated in Figure 3, and even closer when you factor in the weight of collected contamination. Figure 4 breaks down the EPA packaging and container numbers.
If 94 percent access translates into a 43 to 47 percent recycling performance rate, what can we do to achieve greater recycling?
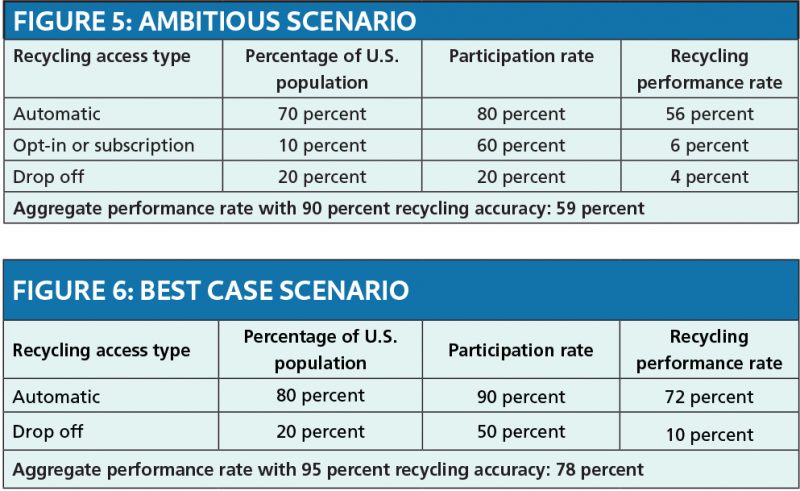 One logical approach would be to try to move more people to an automatic system because that type of collection yields greater participation. Using the recycling performance rate formula identified earlier, it is possible to determine both an “ambitious” and “best case” scenario for recycling performance and to see how higher levels of convenient access can affect those rates.
Figure 5 offers an ambitious scenario, where 70 percent of the population has automatic/universal (up from the 53 percent seen currently), 10 percent has opt-in or subscription (down from 20 percent), and 20 percent has access to drop off (same as current).
The ambitious scenario also assumes significant increases in participation for each group. It is assumed that the automatic group, which currently has a participation range of 60 to 80 percent, will have a participation rate of 80 percent. The opt-in/subscription group, which currently has a participation range of 30 to 38 percent, is assumed to be participating at a rate of 60 percent. And the drop-off group is assumed to have a participation rate of 20 percent instead of the current 9 to 15 percent.
As Figure 5 shows, even with these ambitious increases, the U.S. would be unable to attain a recycling performance rate of more than 60 percent.
We went even further and considered a best case scenario where 80 percent of the U.S. population has automatic access and 90 percent participate, with the remaining population offered drop off and 50 percent participating. While this best case is probably unachievable in the U.S. today or in the future, it’s worth seeing how the numbers play out. Figure 6 demonstrates that even a best case would be unable to achieve an 80 percent recycling rate based on performance (versus a combined weight).
What does it all mean?
Today more than ever, we acknowledge that recycling is critical – not only for its role in mitigating climate change and reducing pollution, but also for brand owners and producers.
Producers understand the value of recycled content in terms of reducing the carbon footprint of their packaging and reducing costs in the long term. Brand owners and packaging manufacturers have corporate goals for including more recycled content in their products and packaging, which necessitates a clean and consistent supply of secondary feedstock. For consistent feedstock to be available, high recycling rates need to exist. Brand owners are also acutely aware of the negative image that comes from seeing their packaging littered in places they should not be.
Producers and brand owners should not rely on municipalities to solve the problem of low recycling rates. They must consider that the recycling system for packaging is not simply one system defined by residential recycling access.
Just as biodiversity in our agricultural systems can reduce a crop’s vulnerability to changes in environmental conditions, diversified collection systems can deliver large amounts of higher quality recycled materials.
The biodiversity analogy can also be used to explain why a diverse recycling system with targeted collection programs is better able to adapt to the changing material mix and consumption habits. In a monoculture, plants are selected based on their ability to grow well under certain environmental conditions, such as temperature and water availability, and therefore are at great risk when these conditions change.
We can think about our recycling infrastructure in a similar way. It was developed to handle the volume and material mix of recyclables from the 1990s and 2000s, most of which were consumed at home (where recycling services were available). The materials and products we consume today are different (lighter and less recyclable), and a larger percentage of the recyclables we generate are generated away-from-home. For many people, unless the process is exceedingly easy, they simply will not recycle.
This article does not purport to have all the answers, but hopes to provide a better understanding of what is needed to move in the right direction. While it is clear that recycling access and levels of convenience in the U.S. must improve, U.S. state and federal lawmakers would be wise to consider the vast array of economic instruments which can drive better performance. These include, but are not limited to: landfill and incineration taxes/fees; pay-as-you-throw and bag limit systems; voluntary take-back systems and mandatory deposit-return systems for some packaging items; green public procurement; and economic incentives for local authorities to promote prevention and develop and intensify separate collection programs.
Just as the resiliency of an agricultural system depends on its diversity in terms of number of crops, high recycling rates are the result of a number of factors – not just access. If we can build a diverse recycling system with targeted collection programs and economic instruments that incentivize participation, the high recycling rates will come.
Clarissa Morawski is principal at CM Consulting and the managing director at Reloop Platform. She can be contacted at clarissa@cmconsultinginc.com. Jason Wilcox is projects manager at CM Consulting and can be contacted at jason@cmconsultinginc.com.