

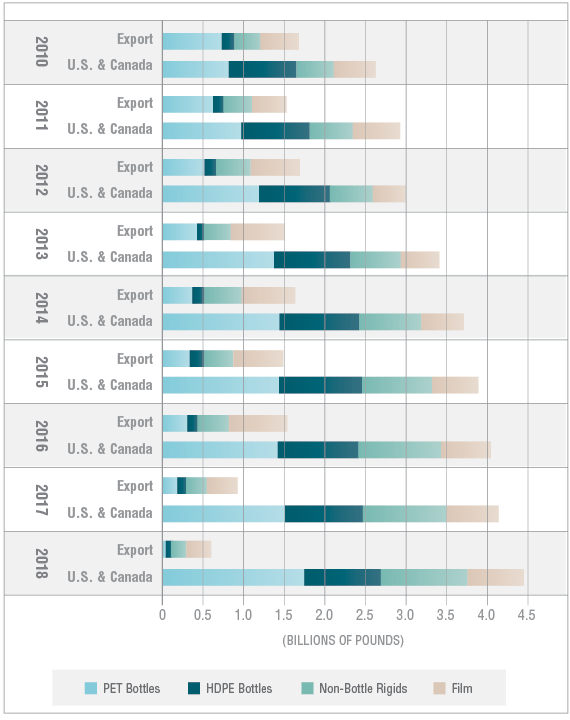
The graph below shows the trends for four major scrap plastic categories tracked and reported as collected for recycling in the U.S., going back to 2010. This chart was made possible through the participation of recyclers and exporters and support from the American Chemistry Council, the Association of Plastic Recyclers, the Canadian Plastics Industry Association and the National Association for PET Container Resources.
From 2010 to 2016, the total amount of post-consumer plastic exported to overseas markets from the U.S. and Canada remained relatively stable, but that number dropped considerably in 2017 and then again slightly in 2018. Domestic processing of scrap plastic is on the rise and continued upward in 2018. Across the four categories, 39% of collected material went to export in 2010; that number dropped to 12% in 2018. Still, domestic growth has not been enough to offset the drop in demand from export markets. Increased use of recycled content and purchasing of products with recycled content is key to increasing the recycling totals. The data is a preview of the non-bottle rigid and film data that will be shared in the soon-to-be-released national plastic recycling reports on those categories.
Sign up at circularityinaction.com to be alerted when the reports are available.
Data Sort is produced each quarter by MORE Recycling. For additional information, go to morerecycling.com.
This story originally appeared in the Spring 2020 issue of Plastics Recycling Update. Subscribe today for access to all print content.