


This article originally appeared in the August 2017 issue of Plastics Recycling Update. Subscribe today for access to all print content.
It’s well understood that last decade’s Great Recession was a watershed moment in global business – and the downturn of course hit recycling.
For materials-recovery stakeholders, the sharp economic drop led to significant decreases in the value of recyclables and also sparked a period of financial struggle for local governments and other entities critical to the industry as a whole.
However, recent research shows the recession may have had a deeper effect on recycling than just short-term revenue or contracting challenges: The fallout from the period appears to have shifted the very suite of factors that influence the value of recyclables. When looking at the last 30 years and adjusting for inflation, material prices for most key materials have actually seen growth over time. But a greater number of economic variables now seem to be playing a role in determining values.
This article outlines an investigation into the specific drivers of recycling price trends and cycles as well as how those drivers have changed in recent years.
The result is a portrait of the way oil prices, economic ups and downs in Asia, port slowdowns and other critical issues are affecting recycling prices in new ways. And on a more general level, the analysis helps explain the complex tapestry that lies beneath the market fluctuations recycling leaders are constantly trying to better understand.
Responding to anxieties over price
The study itself was sparked by discussion among recycling professionals during the slow and shallow recovery that followed the Great Recession. For many, there was concern that depressed prices were representing a new norm.
In an attempt to respond to these types of stakeholder anxieties, the Oregon Department of Environmental Quality (DEQ) partially funded an analysis conducted by Sound Resource Management Group (SRMG) in Olympia, Wash. The final report was published in October 2016.
To start the investigation, researchers needed reliable month-by-month data on the prices garnered for different recovered materials over a substantial time frame. Study leaders determined that the analysis should encompass roughly 30 years of such pricing information, beginning in the late 1980s. This period was targeted because it would include the substantial recycling market price spikes in 1994-1995 and 1999-2000, the dramatic price declines at the end of 2008, and the pricing recovery peaks during the 2009-2012 price cycles.
Because the analysis was spearheaded by the state of Oregon, DEQ asked Oregon recycling market participants to voluntarily provide pricing data covering the last 30 years for eight recycled materials. However, no single Oregon entity was able to provide data covering the entire time frame. Additionally, it became clear that those participating entities were accessing markets at different points in the supply chain, meaning their pricing information would be inconsistent.
Fortunately, SRMG has maintained a database of recycled-material price reports from different municipalities in the Puget Sound area of Washington state. This Puget Sound pricing data covered the duration of the time period required for the study, and researchers determined that those numbers were highly correlated with price data collected from Oregon recyclers.
Even though high correlations do not imply that Oregon and Puget Sound recycling price levels are the same, they do imply that pricing trends and fluctuations are nearly identical. Statistical modeling based on the Puget Sound prices, thus, would be able to provide answers about general price shifts that are applicable to Oregon recycling markets.
The one exception is that Oregon and Puget Sound glass market prices are not significantly correlated. One Oregon recycler did provide data for 2011-2016 to answer the cycles and trends drivers question for recycled glass containers. However, the study was not able to produce results specifically showing glass markets shifts since the recession.
Cycles, trends and drivers for recycling market prices discussed herein are for Oregon and Washington. However, because recycling markets are international in scope, there is good reason to believe that underlying dynamics affecting recycling prices in other parts of the U.S. are similar.
It’s also important to note that the pricing figures shown in this article have been deflated to constant 2009 dollars to eliminate price changes related to inflation. The year 2009 is used as the base because the U.S. Bureau of Economic Analysis (BEA) uses 2009 as the base year for quantity indexes of industry gross output.
Diving into the forces behind pricing
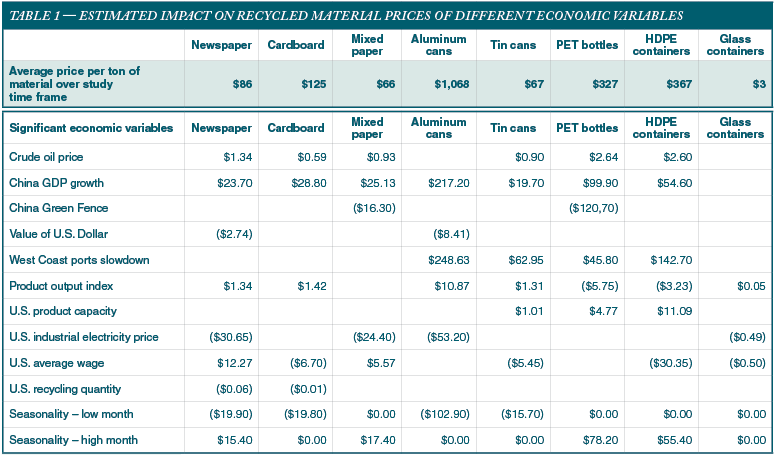
The first row in Table 1 shows the average price for eight important recycled materials over the course of the 28 years studied (1988 through June 2016). Once those price averages were determined, the study moved forward to figure out to what degree important economic variables had affected prices over the course of three decades – and to determine whether the landscape had shifted of late.
SRMG used two statistical models to estimate the quantitative impact of factors that influence recycling market price cycles and trends.
 The first, which we’ll call Model 1, is a statistical estimation procedure that is often used to separate out the individual impacts of multiple economic factors. Model 1 is used here to identify and provide separate estimates for the quantitative price impact of each demand-side factor driving recycling price fluctuations and trends.
The second model, Model 2, is a statistical estimation procedure that is often useful for predicting near-term behavior in economic time series. It relies on the typically rhythmic movements in economic time series to predict future movements based mostly on recent observations. SRMG used Model 2 for checking reasonableness of Model 1 estimates. This reasonableness test is in addition to the usual tests of statistical significance used to validate Model 1 selections of economic variables important for explaining recycling price cycles and trends.
We can look again to Table 1 to see results when these models were applied to economic variables that impact recycling values. The variables are listed along the left-hand side of the table, and the figures in the cells under each of the different material types indicate the price effect for that material when the variable on the left changes by one unit.
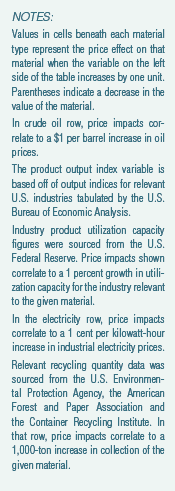
So, for example, a $1 per barrel increase in crude oil price equates to a $1.34 increase in the per-ton price of recovered newspaper, a $0.59 increase in cardboard, a $0.93 increase in mixed paper and so forth.
Parentheses around a number indicate a price drop by the amount specified.
Some of the economic variables, such as “U.S. Western ports labor slowdown,” do not lend themselves to quantification as easily as factors like oil price or GDP growth. For these “event” variables, the numbers under the material categories show the estimated price change when such a phenomenon takes place.
For instance, when a slowdown occurs at a Western port, we can expect the value of a ton of PET bottles to grow by just under $46. However, the implementation of a Chinese customs initiative similar to what was seen during the Green Fence action in 2013 would decrease the value of PET bottles by more than $120 per ton.
Modeling methodology
How exactly were the numbers under the material types in Table 1 determined? Each one is actually an average of up to three statistically significant impacts – one estimated under Model 1 from the beginning of the study period (1988) and running up until late 2008, one estimated under Model 1 for months after that time, and one under Model 2 for the entire study time frame.
Late 2008 was deemed the demarcation point because all the studied recycled materials, other than glass, reached a low point in their price cycles in November or December of 2008. From a recycling values standpoint, the end of 2008 was the most pronounced period of the economic recession.
Let’s now explore how this use of statistical models played out for one material and one economic variable. A good example is the intersection of recovered newspaper (the first material on Table 1) and changes in the U.S. virgin/recycled-content product output index (the sixth item in the list of economic variables).
Table 1 shows that for every point change in the index, the price per ton of recovered newspaper would shift by $1.34. That impact figure is actually the average of three separate numbers: $0.61, $2.74, and $0.67.
The $0.61 number is what researchers found when they used Model 1 to look at the correlation between index changes and newspaper prices from early 1988 through October 2008 – from the start of the study time frame through the height of the recession. The $2.74 number is the result of running the model on these categories from November 2008 through December of 2015 (the end of the study time frame). And the $0.67 figure was the result of running Model 2 for the entire study period.
In the case of the product output index, all three estimates were statistically significant. But in other cases, researchers determined that one or more of the estimates needed to be disregarded.
For example, it was determined that the impact of the quarterly economic growth rate for China on newspaper prices was $23.70. That means if China’s GPD grew 1 percent in a quarter, it could be expected that per-ton price for recovered newspaper would grow by $23.70. Here, the China’s GDP growth was not a statistically significant driver of newspaper recycling prices under Model 2. So the $23.70 figure is an average of Model 1 pre-recession ($11.10) and Model 1 post-recession ($36.30).
How variables have shifted
Because the research had run models looking at the influence of different economic variables over significant periods of time both before and after 2008, the data was in place to make determinations about whether the pricing effects from those variables had changed since the recession. And according to the numbers, major shifts did occur.
The figure below helps to show how researchers used the models to determine the pricing influence of statistically significant variables at different points in time. The gray line in the graph shows the actual value of recovered newspaper over the course of the study period. The light blue line, meanwhile, indicates price estimates using Model 1 before the deep point of the Great Recession, and the dark blue line shows Model 1 estimates since then.
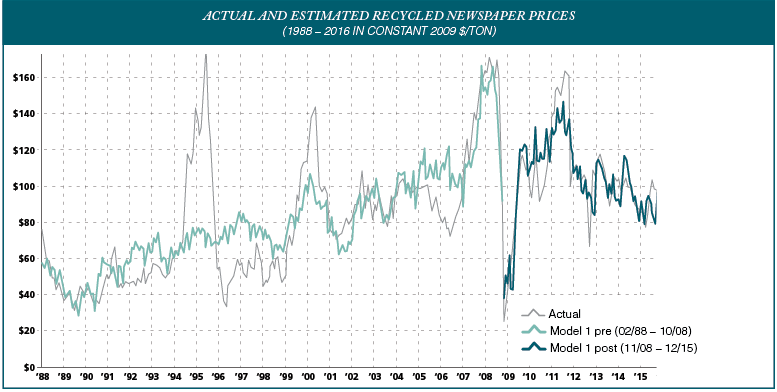
It’s clear that post-2008, the Model 1 estimates correlates closer to actual pricing. This means that the statistically significant variables after the recession explain more of the actual fluctuations than do the statistically significant variables up through 2008.
Similar analysis was run across the material spectrum. And it was determined that after 2008, economic drivers for prices of six recycled materials – newspapers, cardboard, aluminum cans, tin cans, PET bottles and HDPE containers – changed significantly. Mixed paper was the only material that saw no shifts in pricing drivers when comparing pre- and post-2008 data. Determinations could not be made for glass prices because, as was stated earlier, the data in that category only dates back to 2011.
Researchers found that many of the same economic variables were influential both before and after the financial crisis, but their quantitative impacts in some cases broadened across more materials and some strengthened in intensity.
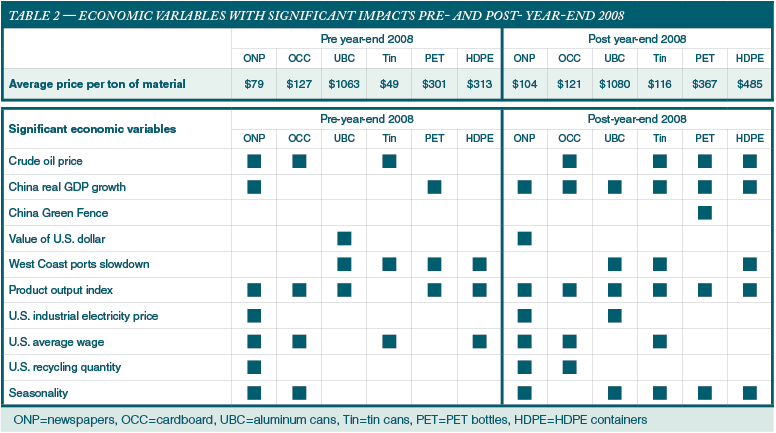
Table 2 lays out the ways different economic variables have over the past decade begun exerting more influence across more materials. The table shows a number of different intersections between materials and economic variables where price influence exists only after the recession. And in some cases, factors that previously affected price no longer do.
For example, before the crisis, the quarterly rate of growth in China’s GDP only proved to impact the price of newspaper and PET. Since the end of 2008, however, China’s economic growth is also affecting OCC, aluminum, tin and HDPE. (Further analysis showed that the economic growth rate in India, not China, affected mixed paper prices throughout the study period.)
Though the chart only indicates whether a material type felt influence from a variable in one of the two time periods and does not get into the specifics on price, it can be helpful to show those details for the China GDP example.
From 2000 to 2011, China’s GDP growth rate saw a monthly average of 2.5 percent. Between 2012 and 2015, however, the rate slowed to 1.8 percent. The study found a drop in average market prices for a ton of recycled material of $24 for newspaper, $19 for cardboard, $143 for aluminum cans, $13 for tin cans, $66 for PET bottles, and $36 for HDPE containers.
Seasonal price swings also impacted metal and plastic recycled material prices beginning in 2009. This may be a reflection of the growing influence of markets for recycled materials in Asia with their seasonal upswing in demand prior to holiday seasons, and drop in demand during holidays and shortly thereafter.
The direct correlation between economic occurrences in Asia and the prices garnered for materials generated in the Northwest underlines a critical aspect of recycling economics: An increase in the supply of U.S. recycled materials has little or no impact on recycling market prices. This is because recycling market price levels are determined on international markets that trade in quantities substantially greater than U.S. recycling quantities. The findings of this study indicate this key recycling reality has not changed in the years since the recession.
Prices actually trending up
Though it’s clear changes have occurred in the pricing power of different economic variables, it’s also important to consider whether such shifts are good or bad for recycling. As was stated earlier, one of the catalysts for this research was concern among stakeholders that materials prices may have emerged from the recession in a permanent rut.
However, despite the pre-financial crisis period containing historic pricing peaks for many materials, average inflation-adjusted recycling market prices for newspapers, mixed paper, aluminum cans, tin cans, PET bottles and HDPE containers were higher after the financial crisis (through June 2016) than they were before – and some were up substantially.
These figures are shown at the top of Table 2. Average prices for tin cans more than doubled, mixed paper and HDPE containers were up more than 50 percent, and newspapers and PET containers were nearly 30 percent higher. By contrast, aluminum can prices were only 1 percent higher. Only OCC saw its average price fall after 2008.
While circumstances affecting markets and demands for specific commodities change, recycled materials remain a strongly valuable resource for manufacturing new products.
Preliminary analysis of Puget Sound data for 2017 showed continued materials price improvements in the first quarter of this year. April in May saw some reversals of those positive trends, which could perhaps be the start of another down cycle or just a bump. With uncertainty around President Trump’s economic policy, China’s National Sword and other developments, the industry will need to continue to analyze the changing nature of pricing factors.
Jeffrey Morris is an owner of Sound Resource Management Group, Inc. and can be contacted at [email protected]. Pete Pasterz is a materials management specialist at the Oregon Department of Environmental Quality and can be contacted at [email protected].