


This story originally appeared in the September 2016 issue of Resource Recycling.
Subscribe today for access to all print content.
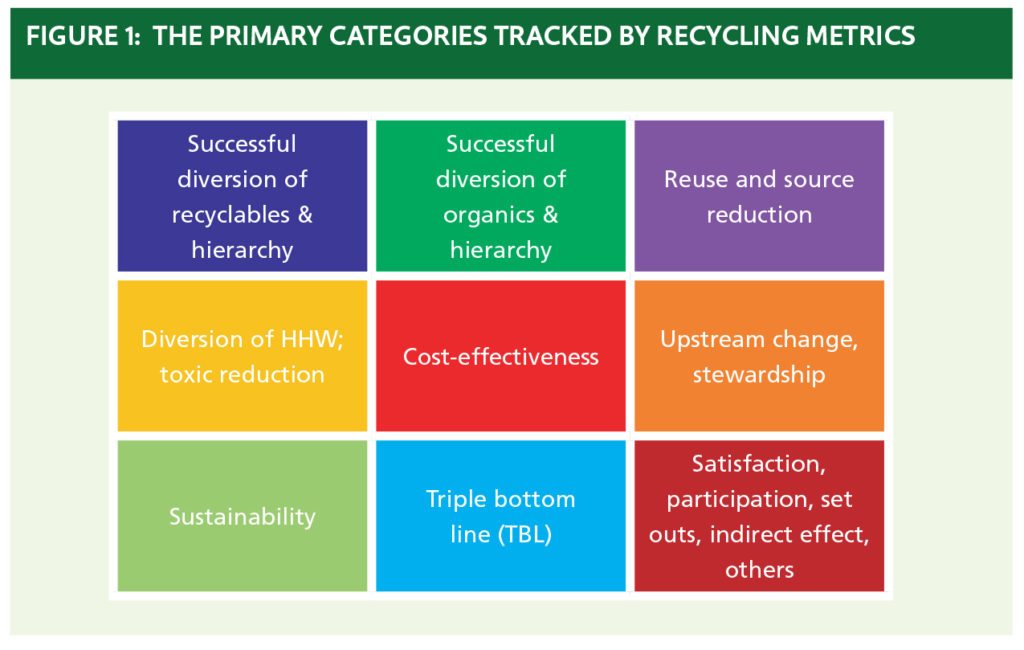
Ideal tracking metrics reflect multiple goals, which can relate to diversion, toxics, sustainability, source reduction and more (see figure below). The best metrics should also enable easy comparisons over time and between communities, they should be affordable to calculate, and they should work in data-difficult situations. But most importantly, they should help inform next steps.
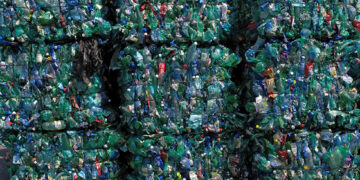
Some states and communities have crafted systems that meet some, but not all, of the goals. However, other communities have very difficult real-world challenges that stand in the way of effective measurement. In the worst case, imagine a state with very limited intervention and no direct authority in the solid waste collection marketplace. It might also rely on many fragmented private haulers with routes crossing community boundaries as well as scores of public and private landfills and processing facilities. Monitoring progress in a place like that is very difficult.
 Data collection in the situation described above is an expensive and spotty proposition at best. Tonnages may not be available, and imprecise and inconsistent translations from cubic yards or customer allocations may be the best available. And that is just the residential sector – the commercial sector is even more complicated, fragmented and ripe for inaccuracies.
Granted, some states have addressed this problem by taking some controls, but there are other locales that are unwilling, unlikely, or unable to do so.
So how can a community, county or state realistically move forward? And are there better metrics, even for those with established systems? A few years ago, my firm decided to tackle this question, and, after testing the approach, we think there is in fact a better option for both advanced communities and those needing their first metric, as well as those in between.
Strengths and weaknesses of current metrics
There has been extensive work – formal work in many states – on the best form for tracking data and goals. The main options have traditionally been variations on the following:
Diversion rate. This is typically the percentage of materials diverted (recycled or composted) and is calculated as diverted tons (recycling plus organics) as a percent of tons “generated” (solid waste plus recycling plus organics). This can also be referred to as a program rate, recycling rate or organics diversion rate, depending on how it is calculated.
Landfill diversion rate. This is a calculation that compares the number of tons of MSW brought to all disposal facilities today with the total MSW tons brought to facilities in a designated “base year.” Decreases reflect diversion from programs and source reduction within the community.
Per-capita generation or diversion tonnages. These numbers are computed as recycling, organics or solid waste tonnages divided by the population size.
All of these measurement approaches carry pros and cons, and they vary in their data and reporting needs (see chart below). The diversion rate attributes progress to recycling and organics, but it doesn’t address source reduction very effectively. Landfill diversion incorporates source reduction, but it doesn’t provide program attribution – that is, it doesn’t tell you which programs are responsible for the diversion. Tons per capita provides interesting data over time and between communities, but it also fails to provide program attribution.
Each metric can show progress relative to the previous year (assuming consistent definitions and measurements are used), and they all allow geographic comparisons. But that’s where the efficiency ends. With the exception of landfill diversion, these metrics require information on several streams – recycling, organics and disposal for the geographic area – and breaking numbers down on that level can be complicated in some communities.
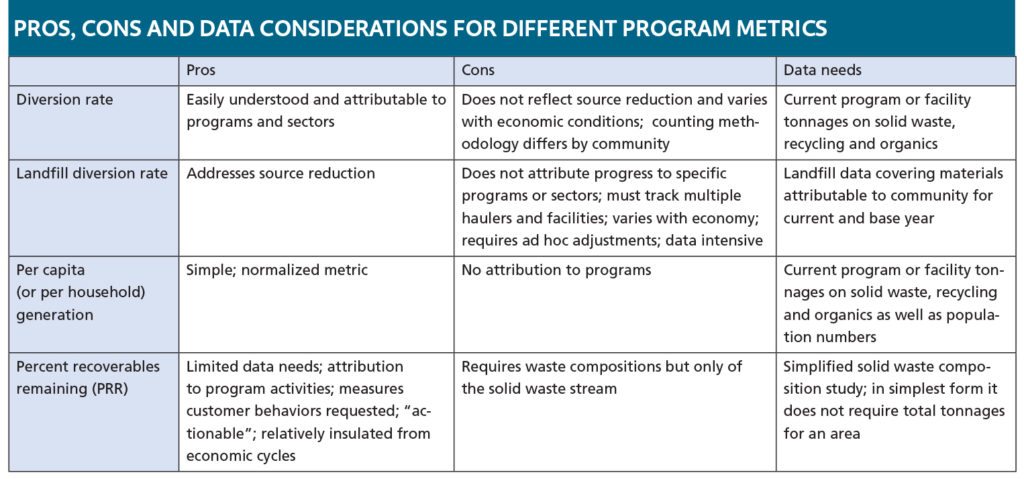
Most importantly, however, is the fact these traditional progress indicators typically do not tell a community what to do next (Oregon’s data-measurement system may be the exception). They do not tell the municipality or state, for instance, which materials are recycled well or poorly, and they do not allow separate computations of residential and commercial performance. The numbers themselves are also prone to vary with economic conditions.
Imagine you are a recycling manager. Let’s say that your traditional metric tells you that you are at a 40 percent diversion rate, which might seem like great news. However, what does that percentage really say about how you are doing?
Likely, the number will lead you to ask additional questions: Have all the recyclables been captured and what specific recyclables remain? Do I need more work in recyclables, or is it now time to focus on yard debris or another stream? How is this program doing in comparison to cities like San Francisco or Seattle that tout even higher diversion rates? Is everyone measuring the same way?
You can’t answer those questions easily from traditional progress metrics. That 40 percent figure doesn’t provide much “next step” guidance.
A fresh data category: PRR
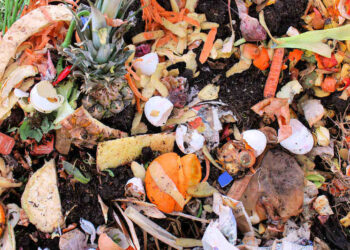
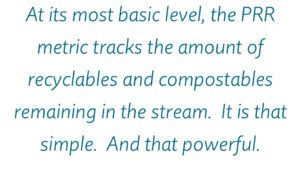
For a number of our clients in different sections of the country, we’ve recently been recommending and incorporating a new metric called “percent recoverables remaining,” or PRR. At its most basic level, PRR tracks the amount of recyclables and compostables still remaining in the disposal stream. It is that simple. And that powerful.
PRR relies only on simplified waste composition studies on the solid waste stream to identify these percentages. Therefore, programs don’t need reporting by haulers or disposal sites. Instead, they need to conduct waste composition studies of the trash stream – at landfills or transfer stations, or from samples of setouts or individual residential or commercial trash trucks. The approach is quite flexible.
Waste compositions, of course, are nothing new, and they are not usually cheap. However, the composition studies necessary for PRR may be substantially less expensive than traditional waste analyses, which commonly sort solid waste into 30 or more categories.
In a PRR analysis, the waste needs only to be sorted into “current recyclables” (or their categories), “current compostables” and “all else,” although more complex sorts provide even more robust information. A program coordinator may want to select specific categories that reflect various goals – for example, toxics could be a category if those types of materials need to be specifically targeted.
PRR is valuable because it allows a program (even one with high recycling rates) to identify what to target next – maybe the analysis shows a lot of HDPE or cardboard is still left to be recovered, for example – and it directly measures the very thing we have asked of residents and businesses: to move things out of the trash.
The metric is also somewhat more immune to economic fluctuations and materials changes. The numbers still reflect the success of getting items that are divertible out of the trash stream relative to the stream the generators are facing. Not only that, program leaders can also identify the lost (or “buried”) value of what’s being disposed.
 Case Study on PRR
Always innovating, StopWaste (the waste management authority in Alameda County, Calif.) was on a parallel track, and several years ago implemented PRR, which StopWaste calls “Percent Good Stuff in the Garbage.” The authority’s own 2008 Waste Characterization Study showed 60 percent “good stuff” across all sectors, and thinking aspirationally, StopWaste determined its combined recycling and organics PRR goal would be less than 10 percent “good stuff left” in the trash stream. Later review of waste composition studies from other communities around the nation revealed 30 percent or so to be the best performance to date. Rather than a landfill-based measuring approach (which others have used), StopWaste uses a setout-based sort system, regularly bagging, tagging and sorting random setouts from single-family, multi-family and business properties to get “good stuff left” percentages from each of these generator types. The program has seen progress (percentage point decreases) in the numbers, and officials have been able to learn about next steps, such as food targeting, as part of this informative measurement plan.
The power of simply looking at the stream
Traditional metrics have been useful, but measurement issues can be complicated, expensive, or impractical (and potentially inaccurate anyway) for some areas. Furthermore, although they are intuitive and simple, traditional metrics fall short on the scale of “useful” in terms of informing next steps for communities.
In a world where everything old is new again, it may be wise to bring back the practice of periodically looking at the waste stream to figure out how programs are actually doing and to learn what makes sense next. To implement PRR, there can be complexities in design and measurement planning (we’ve worked out many feasible alternatives, considering local issues), but it’s clear the analysis is worthwhile for many communities.
In some cases, clients have added the PRR alongside a long-time favorite progress metric. For your programs, consider whether moving forward might mean simply going back to basics.
Lisa A. Skumatz is an economist and principal of SERA, Inc. as well as the nonprofit group Econservation Institute. She works with jurisdictions and states on program and policy planning and evaluation as well as cost-effectiveness/efficiencies/benchmarking, and social marketing assignments. She can be contacted at [email protected].
The author wishes to specifically thank Tom Padia and Debra Kaufman of StopWaste in California’s Alameda County for several very helpful discussions on their program.