
This article appeared in the April 2020 issue of Resource Recycling. Subscribe today for access to all print content.
In cities across North America, officials must balance a range of needs and priorities when making decisions about local waste management, but that raises questions about quantification. Is it possible to measure program progress across a range of criteria? What would such reporting look like?
For answers, we can look to the Pacific Northwest’s largest municipality.
Over the past 40 years, the city of Seattle has developed a framework for residential municipal solid waste (MSW) that has yielded long-term successes in three distinct categories. The city has seen:
- Steadily decreasing disposal per household.
- Cost savings for ratepayers.
- Substantial reductions in potential human illnesses and other environmental pollution impacts.
In Seattle, virtually all residentially generated garbage, recyclables and organics are handled via city-managed private contractors and the two city-owned transfer facilities. Hence, data on Seattle-generated residential waste quantities and their costs are accessible, complete and verifiable. (Commercial MSW also shows declining disposal rates and reduced environmental impacts, but cost savings for commercial garbage customers are difficult to document because most commercial recycling and organics diversion is privately conducted outside the city contract structure.)
This article uses residential MSW data to illustrate and explain the “triple win” the city has seen from its residential MSW strategies.
Winning by reducing disposal
The graph shown below shows the success among Seattle’s residential households, including both single-family and multi-family residences, in diverting MSW materials from garbage to recyclables or organics collection.
The dark green line on Figure 1 measures average residential household garbage disposal each collection day per month from January 1977 through December 2018. The lighter green line is the average household’s combined pounds of garbage, organics and recyclables set out at the curb on collection day (this line starts in 1989, when curbside collection of recycling and yard debris began to be offered to residents).
Disposal declined from an annual household average of 6.2 pounds per collection day in 1977 to 2.4 pounds by 2018, a decrease of 61%. Furthermore, the graph shows that combined collection-day organics, recycling and garbage set-outs by the average household has trended downward since 2010. This is a sign of more efficient use of materials overall.
Some of the key programs and regulations implemented by Seattle are noted on the graph, highlighting their connection with substantial drops in disposal per household. For example, in 1988 and 1989, large drops in household garbage disposal were seen after the introduction of curbside collection for recyclables and yard debris from single-family households. That time period also saw a ban on putting yard debris in the garbage and the establishment of on-site collection of recyclables from apartment buildings. Yard debris collection and the disposal ban also smoothed out seasonal variability of remaining garbage disposal.
Over subsequent years, a number of additional programs and regulations went into place, including: (1) expansion of material types collected for recycling, (2) a ban on putting recyclables in the garbage, (3) universal single-family and multi-family organics collection subscription mandates, (4) collection expansion to include food waste and food-soiled paper collected in with yard waste, and (5) a ban on putting these organic materials in the garbage. Each contributed to the continual decline in garbage disposal by the average residential household.
The orange disposal line on the graph portrays statistical calculations that identify significant factors explaining cycles and trends in residential garbage disposal. Its close match with actual residential disposal indicates that this statistically derived estimate for household disposal accurately identifies and measures those factors that drive residential household behavior. Statistically significant factors that were identified include programs such as curbside collection, regulations such as disposal bans, weather and other seasonal influences, and economic variables such as income and garbage collection fees.

The daily average collection weights shown in the chart account for collection from both single- and multi-family residences. | Click to view full size in a new tab.
Garbage fee impacts depend on availability of convenient opportunities for diverting discards to recycling and composting, and the extent to which garbage collection fees increase when a household’s garbage disposal quantities go up.
Prior to January 1981, Seattle households with curbside garbage collection all paid the same garbage collection fee regardless of how much garbage they set out for collection. That changed when Seattle began charging pay-as-you-throw (PAYT) fees related to the size of a household’s garbage cart.
At that time, a 32-gallon can or cart began to cost $6.40 per month, a 64-gallon cart $7.90, and a 96-gallon cart $9.40, all for once-per-week collection. After 1981, charges for larger garbage carts went up more steeply. Collection fees beginning September 1994 were $16.10 for weekly collection of garbage placed in a 32-gallon can or cart, $32.15 for 64-gallon carts, and $48.25 for a 96-gallon cart – basically a linear fee of about $0.50 per gallon of garbage collection as cart size increased.
However, as indicated by the graph, PAYT did not significantly reduce disposal weights until the late 1980s, when households began to have access to curbside recycling at no additional cost and fee-based yard debris collection that was as convenient as curbside garbage collection. Prior to then, households had to haul recyclable materials to privately operated recycling drop-off centers scattered rather sparsely around the city. Households wanting to keep yard waste and other organics out of the garbage had to compost those organic materials on-site in their yards.
Some causes for the recent decline in overall waste generation include the following: changes in the composition of household discards, decreases in the weight of materials used for packaging products, cessation in 2009 of print publication of one of Seattle’s two major newspapers, and recent increases in the proportion of multi-family households versus single-family households in Seattle (on average, multi-family households generate less material than single-family households).
Winning by Reducing Costs for Ratepayers
Seattle contracts with service providers for collection of garbage, organics and recycling from residential households. The city also contracts for the processing of collected recyclables, composting of collected organics, rail-haul and landfill disposal of collected garbage, and some hauling from transfer stations of garbage to the rail head and organics to composting facilities.
In all these contracts, a substantial portion (in some cases 100%) of the price paid for services is determined by the tonnages handled. These are therefore defined as variable costs – when recycling or organics collection tonnage goes up and garbage collection tonnage goes down, the city pays more for diversion and less for garbage.
At the same time, there are some fixed costs in the system. For instance, the cost to send trucks out for curbside collection is fixed, remaining the same regardless of how much tonnage is generated by residents. For each material category (garbage, recycling and organics), the average overall cost per ton in a year is determined by adding the variable cost total to the fixed cost total and dividing that sum by the tonnage associated with the category in question.
The table below shows variable and average costs per ton in 2018 for managing collected materials. Costs in the table are disaggregated according to activities involved in handling the materials. For collection, the figures represent the weighted average for curbside household and on-site apartment building collections.
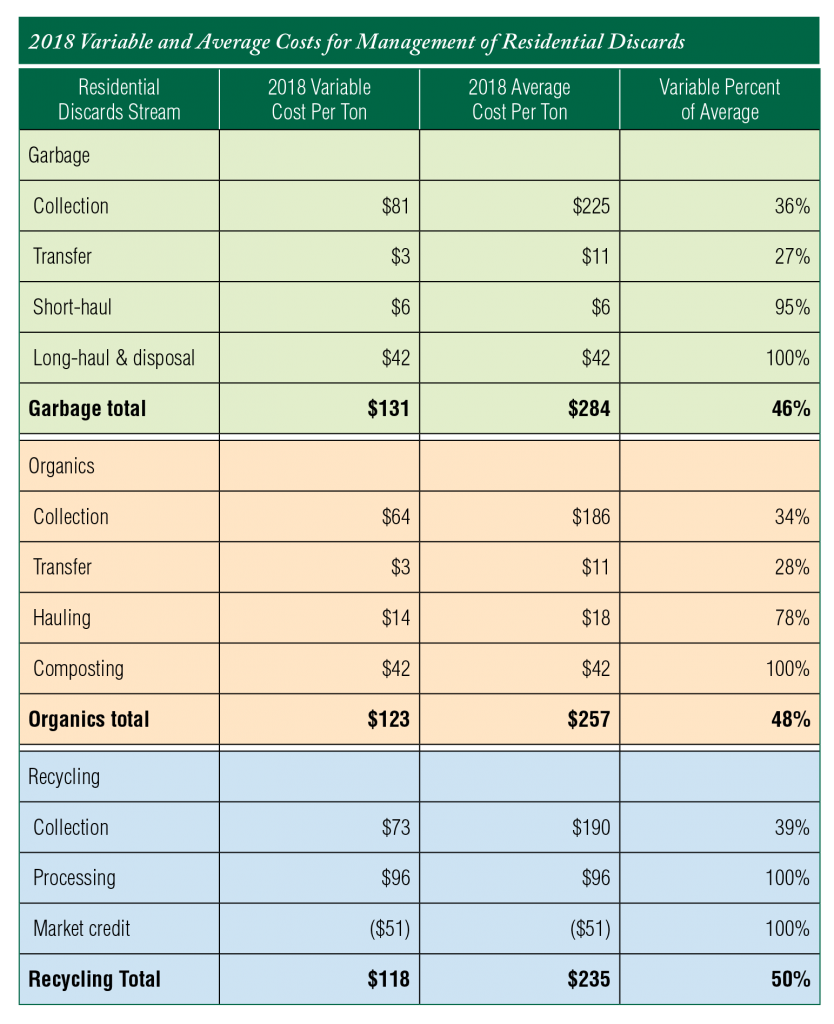
In 2018, both variable and average costs per ton for recycling and composting were lower than those for garbage. For recycling, this is especially significant because 2018 was a year when prices paid for processed recyclables were particularly low. Seattle Public Utilities (SPU) receives a third-party-calculated market credit from its contracted recyclables processor that offsets a portion of processing costs. That credit was only $51 per ton in 2018. This compares with the previous year (2017), when the market credit was over $85 per ton.
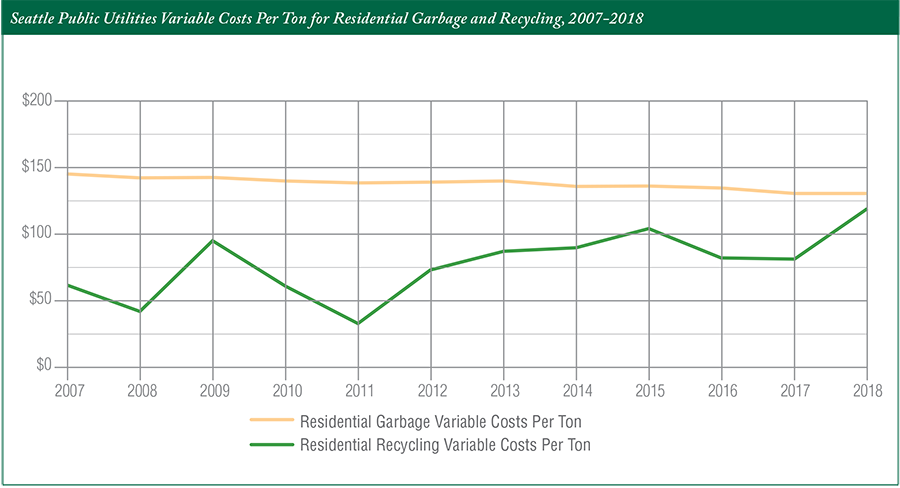
The graph below shows the effect of SPU’s specifying that contracts must split costs into fixed and variable portions. The graph shows that residential garbage variable costs per ton have been higher than recycling variable costs per ton for each year from 2007 through 2018. That means that when diversion programs, garbage collection fees, or regulations cause households to move recyclable materials out of the garbage cart and into the recycling cart, costs for managing MSW go down.
In eight of the 12 years depicted by the graph below, recycling market prices were robust. Garbage variable costs, which are avoided by recycling, exceeded recycling variable costs by over $50 per ton. In three years when recycling markets were less robust, but still better than in 2018, residential recycling was less costly than garbage by at least $32 per ton. In 2018 recycling’s cost advantage over garbage fell to $13 per ton. During 2007 through 2018, savings from recycling reduced the average residential customer’s solid waste collection bill by $1.45 per month (measured in 2018 dollars).

Winning by reducing environmental costs
In 2004, SPU began estimating the external benefits of recycling and their associated savings in environmental costs (it did this through the “On the Path to Sustainability” amendment to the agency’s Comprehensive Solid Waste Management Plan).
Environmental costs account for damages not covered by prices paid in the marketplace for products and packaging. Such damages include climate change, human health-respiratory illness, human health-toxics illness, human health-carcinogenic illness, waterways eutrophication, acidification, ecosystems toxicity, ozone layer depletion, and ground level smog formation.
To measure environmental impact costs, SPU has used a tool from Sound Resource Management Group called the Measuring Environmental Benefits Calculator (MEBCalc). More information on how those calculations are formulated can be found at srmginc.com/images/GMS-MEBCalc.pdf.
According to analysis using MEBCalc, garbage disposal life-cycle environmental costs avoided by diverting recyclables to recycling collection are substantially higher than recycling environmental costs. From 2007 to 2018, environmental costs for diverted recycled materials had they been thrown in the garbage would have averaged $1,292 per ton (in 2018 dollars). Instead, recycling those materials imposed life-cycle environmental costs averaging only $223 per ton. In other words, the difference between garbage environmental costs avoided by recycling and recycling’s environmental cost is $1,069. This difference is recycling’s net environmental benefit for each ton recycled.
Recycling’s net environmental benefit is large because recyclable materials left in the garbage cart can’t be used in the production of new products and packaging. This means more virgin raw materials must be used. Extracting virgin materials and fuels from global ecosystems and refining them for use in manufacturing new products imposes substantial environmental cost. Much of this upstream cost is avoided when recycled materials replace virgin materials, reducing both virgin raw material and energy use.
For both recycling and disposal, life-cycle environmental costs tend to be concentrated upstream from MSW management activities. For example, in 2015 if Seattle’s recyclables had remained in the garbage, environmental costs for virgin raw materials and fuels extraction and refining, plus manufacturing of virgin-content products, would have accounted for 97% of those materials’ garbage-life-cycle environmental costs. Garbage collection, transfer, rail hauling, and landfilling environmental impacts would have accounted for the remaining 3%.
Similarly, for recycling in 2015, 79% of environmental cost was from upstream resource extraction and recycled-content product manufacturing. Managing contaminants in household recycling carts accounted for 14% and material recovery facility (MRF) processing 5%, with the remaining 2% of environmental costs attributable to recycling collection and hauling processed recyclables from the MRF to recycled-content product manufacturers.
Recycling’s net environmental benefit changed only slightly from 2007 to 2018. It declined by 8% between 2010 and 2015. Why? Contaminating garbage in household recycling collection carts increased from 5% in 2010 to 10.5% by 2015. Also, households recycled proportionally more glass and less newspapers. Glass has lower net upstream environmental benefits than recycled paper, cardboard, plastics or metals.
Lastly, human health respiratory impacts from small particles and their precursors account for over half of MSW life-cycle environmental costs. Waterways eutrophication accounts for about 25%, while climate change impacts account for between 10% and 15%, and the other six in total for about 5%.
Most eutrophication costs are associated with upstream impacts. Eutrophication accounts for less than 5% of collection and hauling environmental impacts, while climate change accounts for 30%. Particulates emissions still impose over half of collection and hauling environmental costs.
A strong rebuke to materials diversion naysayers
Seattle’s MSW management system has provided – and continues to provide – programs, incentives and regulations that have resulted in long-term declines in disposal, cost savings for ratepayers, and substantial environmental benefits.
These successes are all the more remarkable given widespread fears that recycling doesn’t make economic sense due to current recycling market price reductions combined with high MSW management costs. The numbers laid out in this article refute those who will downplay the climate, public health and ecosystem benefits of diverting MSW materials from disposal.
Seattle leads the way forward against these fears and doubts by taking the triple-long-view in managing MSW.
Jeffrey Morris, Ph.D., is an economist who runs Sound Resource Management Group, Inc. He can be contacted at [email protected].