For the first time, a comprehensive map of municipal materials recovery facilities across the country has been compiled and released for public use.
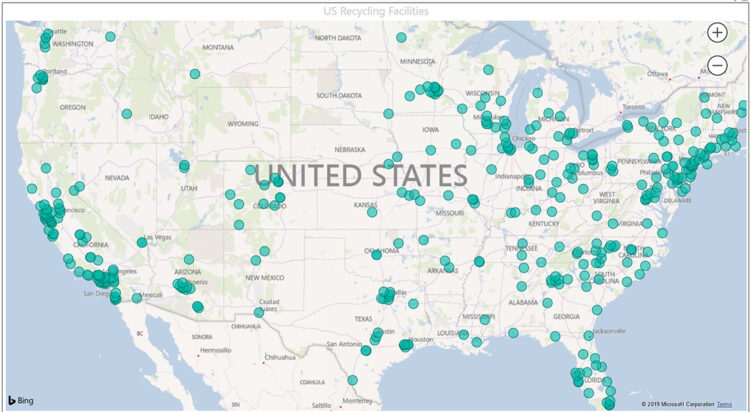
The Recycling Partnership on Oct. 22 the published map detailing more than 350 residential recycling sorting facilities. It provides a geographical picture of which regions are well-served with recycling infrastructure and which areas need the most help.
Scott Mouw, senior director of strategy and research at The Recycling Partnership, said the map serves as a sort of accounting or census of what the landscape of MRFs looks like across the country. That information, he noted, is key to connecting downstream stakeholders with a significant component of the recycling infrastructure that serves communities.
“It’s important to all the programs across the country, it’s important to the markets that source their material from households, and yet it really hasn’t existed in any kind of very focused form nor been displayed publicly before,” Mouw said.
One important goal for The Recycling Partnership was to be precise in the language it used to define a MRF. For instance, this project did not want to conflate C&D MRFs with those handling the curbside stream. The aim was to achieve an apples-to-apples comparison.
“These are facilities that are focused on residential material, taking in commingled in some way shape or form, single-stream or dual-stream, not mixed waste, and then move that material to the market,” Mouw explained.
That means facilities that take in source-separated material, bale it and ship it out were not considered MRFs for the purpose of this project. Some level of sorting is required to fit the definition.
“We want to drive a conversation where we talk about MRFs in a very defined way,” Mouw said. “It helps us have conversations that advance the system, quite frankly.”
The data for the map came from a number of sources, including a large database compiled by Resource Recycling. The Recycling Partnership added to that information from the organization’s own staff knowledge of facilities around the country, completing some light research to determine what type of MRF each facility is.
Finally, the team shared the data with a number of state recycling offices to vet it with local experts.
“We think we’re pretty darn close to having an accurate representation of most of the residential MRFs in the country,” Mouw said. “We also, then, are mindful that it’s not perfect.”
Part of the exercise, he said, is to refine the map if there are errors. To that end, TRP is asking readers to share any information that might help advance the map so it has the most up-to-date and accurate information.
Looking at the geographic representation of MRF infrastructure, some dramatic differences by region are particularly clear. Major population centers like California and the Northeast have an abundance of residential sorting facilities. North Dakota and Wyoming, however, have no MRFs. Large swaths of Texas are also barren on the map.
“There are a lot of large towns there, pretty decent sized towns, that don’t have ready access to MRF processing,” Mouw said.
“There are parts of the country that are truly processing deserts, and parts of the country that are truly overbuilt,” he added.
‘Circularity’ report released
In addition to the map, The Recycling Partnership this week released “The Bridge to Circularity,” a report outlining how the current U.S. recycling system is insufficient to handle the amount of packaging waste being generated.
The report found there is an annual gap of more than 1 billion pounds between the current U.S. supply and projected 2025 demand for recycled PET for use in bottles. The report called for investment of $250 million over five years to boost the capture rate for packaging and another $250 million over five years to “design and implement the future recycling system.”


