
In early March, the U.S. Department of Commerce released numbers for U.S. export activity in December 2018, allowing the industry to make full-year comparisons between 2017 and 2018. And because China’s National Sword policy took effect Jan. 1, 2018, the data helps illustrate the impacts China’s policy had on the global flow of recyclables.
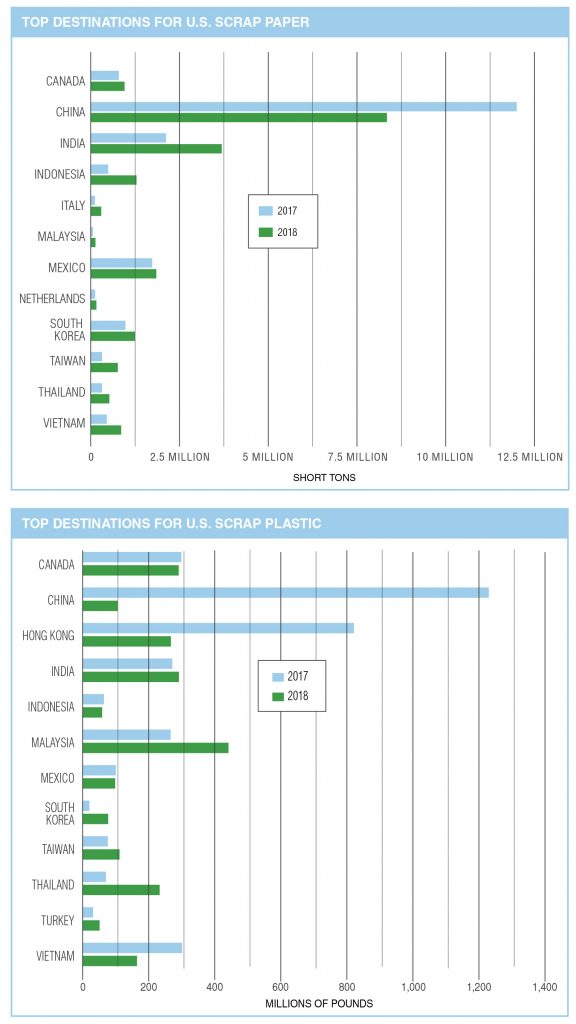
Overall, U.S. companies exported nearly 21.0 million short tons of recovered fiber in 2018, which was actually up from 20.1 million in 2017. But as the top chart below shows, recovered fiber was moving in new directions. China reduced fiber imports by 3.7 million tons while there was significant growth in exports to India, Indonesia, South Korea and elsewhere.
The trade numbers show a striking trend by grade for fiber. Mixed-paper exports dropped roughly 25 percent, from 3.9 million short tons in 2017 to 2.9 million in 2018. OCC exports, however, grew nearly 27 percent, increasing from 9.9 million short tons to 12.5 million short tons.
On the plastics side, the U.S. exported 1.3 billion fewer pounds of scrap plastic in 2018 than the year before, representing a 35 percent decrease.
Exporters shipped 2.4 billion pounds of scrap plastic last year, down from 3.7 billion pounds in 2017 and 4.3 billion pounds in 2016.
China went from receiving 33.4 percent of recovered plastic exported from the U.S. in 2017 to just 4.5 percent in 2018. Hong Kong went from importing 22.4 percent in 2017 to 11.3 percent last year (much of what is shipped to Hong Kong is re-exported to mainland China).
Many other countries brought in a larger share, most notably Malaysia, which saw its share of U.S. scrap plastic jump from 7.3 percent to 18.8 percent.
By weight, the largest importers of U.S. scrap plastic in 2018 were Malaysia (443 million pounds), Canada (294 million pounds), India (294 million pounds), Hong Kong (267 million pounds), Thailand (235 million pounds), Vietnam (165 million pounds), Taiwan (114 million pounds), China (106 million pounds), Mexico (101 million pounds), South Korea (78 million pounds), Indonesia (60 million pounds) and Turkey (52 million pounds).
This article appeared in the April 2019 issue of Resource Recycling. Subscribe today for access to all print content.