


This story originally appeared in the August 2016 issue of Resource Recycling.
Subscribe today for access to all print content.
In late June, the authors of this article released a white paper that had been in the works for nearly a year. The paper was called “Demystifying MSW Recovery Rates,” and within a day of publication, the feedback started streaming in. Messages included the following:
“My city’s recycling rate always gets compared unfavorably nationally. We are only responsible for residential MSW. Most cities include commercial. Your findings are helpful.”
“I have observed many of the findings your paper has brought to the forefront. … I hope we will take action to implement your recommendations.”
Clearly, there is a real thirst among industry professionals for accurate, data-driven information regarding the volume of MSW generation and recovery in the U.S. And that’s nothing new. Readers of this publication may remember an article, “Death to Recycling Rates,” that was written by Resource Recycling’s Jerry Powell and published in March 2011 [that article can be found here: tinyurl.com/RR-RecyclingRates]. Powell’s story also underscored the need for more consistency in counting.
The goal of the recently released white paper was to enhance the knowledge of solid waste and recycling leaders with fact-based information and to illustrate inconsistencies in the current data. To do so, we aimed to do three basic things:
- Compare two differing national recovery rate calculations and determine the most accurate approach
- Examine how local and state government recovery rates are calculated
- Understand the differences between residential and ICI (industrial, commercial and institutional) MSW generation, and subsequent recovery within each sector
In this article, we’ll take a look at the importance of those three areas and detail the white paper’s key findings for each section.
The most accurate national rate
Napoleon famously said that “war is 90 percent information.”
Those of us with responsibility for solid waste and recycling activities are in our own war of sorts – working in the trenches to meet recovery goals, reduce costs and improve program performance in response to a multitude of stakeholders. Quality information is essential as we wage these battles. And this brings us to the first focus of the white paper: What is the most reliable source of data to measure and benchmark MSW generation and recovery statistics?
To determine national MSW generation, recovery and disposal, the U.S. EPA utilizes a complex materials-flow analysis to estimate generation and recovery based on production, imports, exports, expected product totals and packaging life cycles, with input data from multiple sources. EPA’s analysis results in statistics that are quoted widely by recycling stakeholders as well as mainstream media.
According to the agency’s most recent figures, which cover 2013, total MSW generation in the U.S. is 254.1 million tons, of which 34.4 percent is recovered. EPA divides that figure further: Approximately 25.5 percent of MSW (65 million tons) goes toward material recovery, and 8.9 percent (22 million tons) goes to organics recovery.
Many have argued for quite some time that the EPA estimate of total MSW is understated, while the recovery rate percentage is overstated.
EPA is not the only entity that works to calculate a national recovery rate, however. The Environmental Research and Education Foundation (EREF), a nonprofit group that focuses solely on waste management research and education, has analyzed materials recovery using a method that’s very different than the one used by EPA – and recently reported numbers quite different from EPA. Unlike EPA and its material-flow analysis approach, EREF uses a “bottom-up” approach that relies on extensive surveys of U.S. MSW management facilities of all types (recycling, composting, waste-to-energy and disposal). The findings also take into account dozens of waste characterization studies. The group’s results, in other words, are based on actual tonnages and material-type trends seen in facilities.
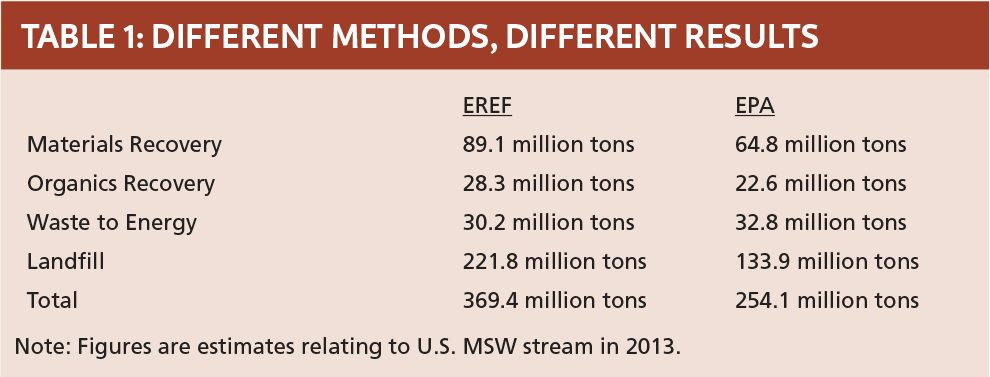
According to EREF, in 2013 the U.S. generated 369.4 million tons of MSW, or 45 percent more MSW than was estimated by EPA (see Table 1). Their estimated national recovery rate was 31.8 percent, of which materials recycling was 24.1 percent (89.1 million tons) and organics recovery was 7.7 percent (28.3 million tons).
In the opinion of the authors, the EREF information is more accurate – this judgement is based on the quality of the data presented and the several decades of experience the authors have in the fields of MSW and recovery. In addition, the EREF methodology is much more similar to the way states and local jurisdictions measure MSW – that is, numbers reported by collection, processing and disposal facilities. For those reasons, the white paper used EREF data as the basis for its assessments and recommendations.
Cacophony of calculation approaches
Imagine if every team in a professional sports league had its own methodology for calculating players’ statistics.
That is sort of what we see as state and local jurisdictions calculate their materials recycling and recovery rates. There is no consistency, lots of confusion and maybe a little exaggeration going on due to recovery-rate envy (“my city recovers more than your city”).
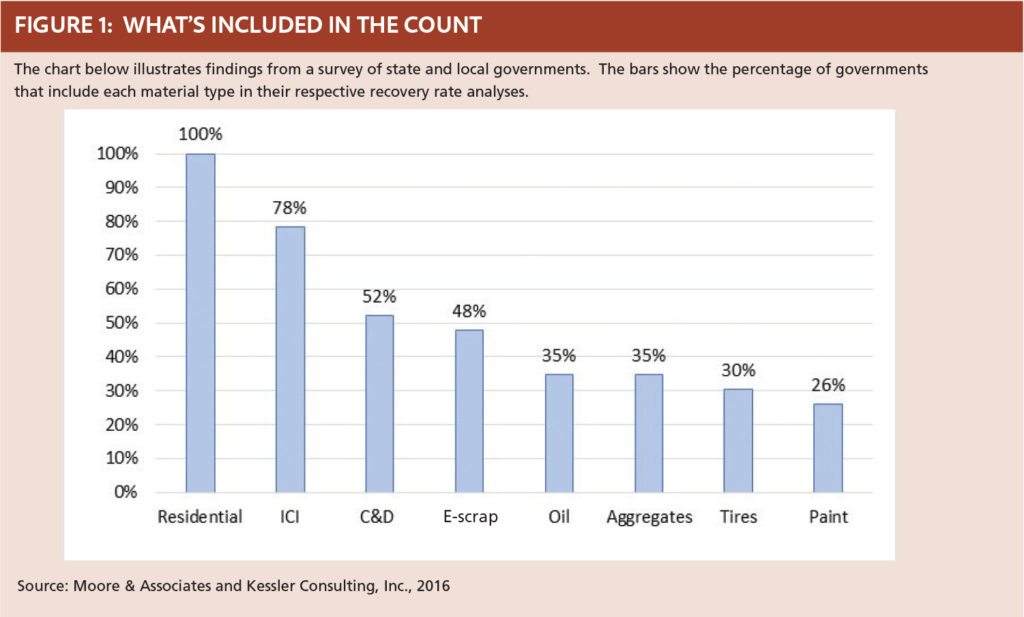
State and local governments face multiple challenges collecting complete and accurate recovery and disposal data. We surveyed a sample of cities and states and found huge discrepancies in the types of waste and treatment methods they include in their recovery rates (see Figure 1).
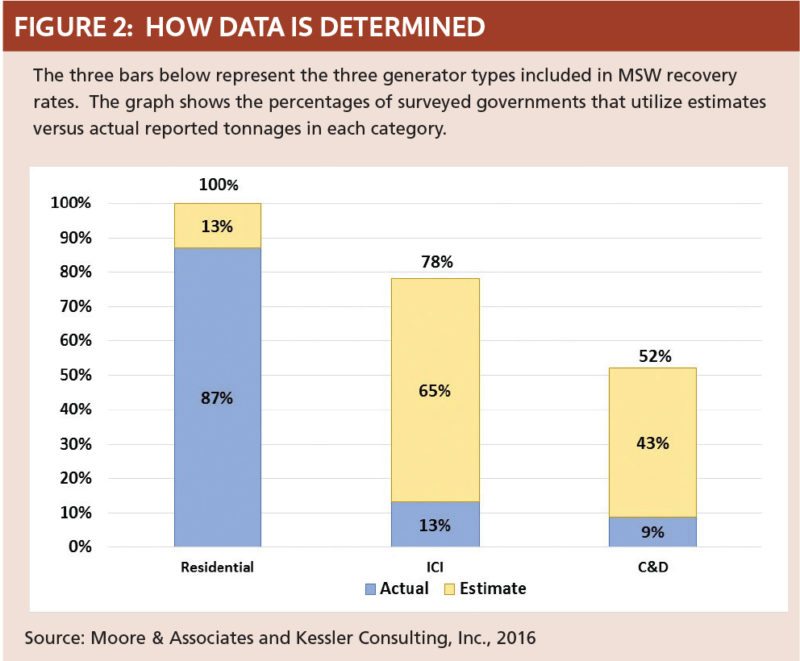
Furthermore, while most communities have actual residential recycling tonnages, the vast majority of those that include ICI or construction and demolition (C&D) tonnages in their recovery rates rely on estimates rather than actual data (see Figure 2). For instance, 78 percent of the cities and states we surveyed include ICI tonnage in their calculations, but of those cities and states, 83 percent estimate the ICI recovery rate. A similar phenomenon exists for the jurisdictions that include C&D recovery in their calculations. With this much variation in how counting occurs, apples-to-apples comparisons can rarely be made.
If we are serious about truly understanding what’s being recovered and where material is generated, then the industry needs to address the cacophony of formulas and definitions that exist in our state and local governments.
Whenever you see a recovery rate quoted or compared, you need to ask three questions:
- What generator types are included in recovery and what types are included in disposal?
- What categories of materials are included in recovery?
- How is the data collected and reported?,/li>
It is only by developing consistency in those areas that the industry will be able to make true comparisons between different jurisdictions.
ICI: An overlooked sector
With all of this as a backdrop, the white paper turned to its third major focus: developing generation and recovery estimates based on the source of MSW. Numbers that keep the source of material in mind are essential to informed dialogue regarding recovery policy, investment and program operations. Our assessment found important distinctions between ICI sources and residential sources.
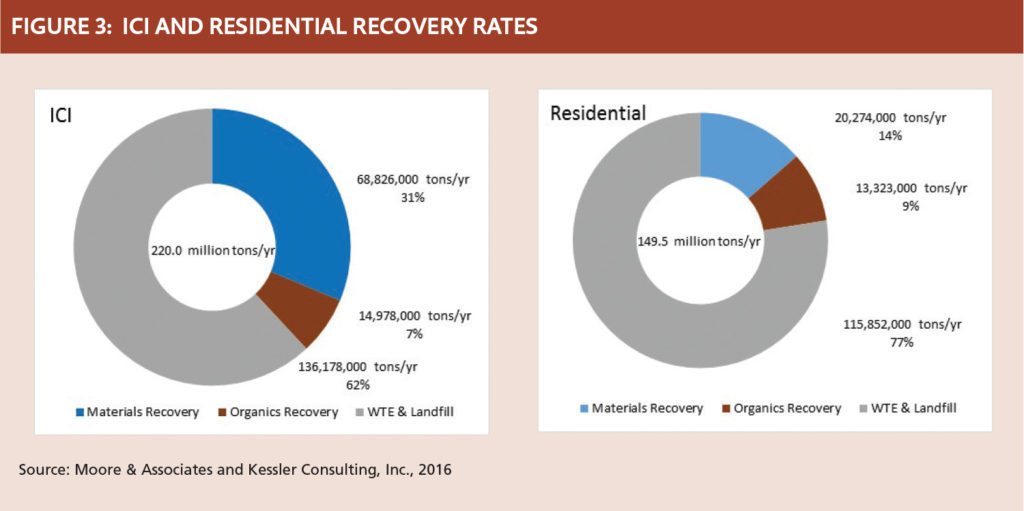
Research for the white paper found that most MSW in the U.S. (220 million tons annually, or 60 percent) comes from ICI generators, while 40 percent comes from the residential side. Looking further and determining recovery breakdowns, we see an even sharper difference (see Figure 3). We estimate when it comes to ICI MSW, 38 percent of material is recovered (31 percent materials recovery plus 7 percent organics recovery). Compare that to residential recovery of 23 percent (14 percent materials recovery plus 9 percent organics recovery). At the end of the day, we must face the fact that 77 percent of materials recovery comes from the ICI sector, and only 23 percent comes from the 116 million residences in the U.S.
Thousands of huge ICI generators exist in the U.S., including supermarkets, big box stores and manufacturing facilities. These large facilities have a unique edge when it comes to recovering materials – they have scale. Some, in fact, are able to recover 80 percent or more of their discards.
However, not all ICI facilities have scale. In fact, recycling is a struggle for most small and medium-size ICI properties – think office buildings, restaurants, delis, convenience stores and strip malls.
The residential sector faces the scale problem as well. MSW generation in the U.S. is a mere 7 pounds per household per day, and of that, about 1.5 pounds is currently recovered (and a third of that recovery is yard waste debris and other organics). When it comes to materials recovery, we estimate the average U.S. household diverts 350 pounds per year, equating to a household materials recovery rate of 14 percent (excluding container deposit recycling).
With over 85 percent access to some type of recycling, the residential sector will continue to be a major focus for policies, programs and investments to improve recovery rates. However, we believe equal focused should be placed on the small and medium-size entities in the ICI sector. Every waste composition study that Kessler Consulting has performed in recent years has found plenty of recoverable material remaining in both residential and ICI waste. We see two recycling paradigms: few large generators with market-driven recovery versus many small generators with program-driven recovery.
Steps to better statistics
We ended our white paper with three recommendations.
When it comes to calculating waste generation and recovery, the “bottom-up” approach based on actual tonnages handled by facilities should be utilized consistently at the national, state and local levels.
If we want to compare recovery rates, we need to establish common definitions and methodologies that must be adopted by state and local governments. A national government agency, such as EPA, may be best prepared to serve this role.
Communities that are seeking to maximize recovery need to look beyond their residential sector. Likewise, industry stakeholder initiatives currently focused on funding and implementing best practices to maximize residential recycling may be well-served by investing comparable efforts in the ICI sector.
Bill Moore is president of Moore & Associates, an international consulting firm based in Atlanta that provides a range of market research and strategic services to the paper recycling industry. He can be contacted at MARecycle@aol.com.
Peter Engel is a senior consultant at Kessler Consulting, Inc., a Tampa, Fla.-based solid waste strategic planning firm that works with clients in the public and private sectors to provide innovative and practical solutions for a wide range of solid waste management issues. He can be contacted at pengel@kesconsult.com.