


This article appeared in the December 2020 issue of Resource Recycling. Subscribe today for access to all print content.
The majority of the more than 200 billion beverage containers used in the United States each year end up in the landfill, despite current recycling efforts.
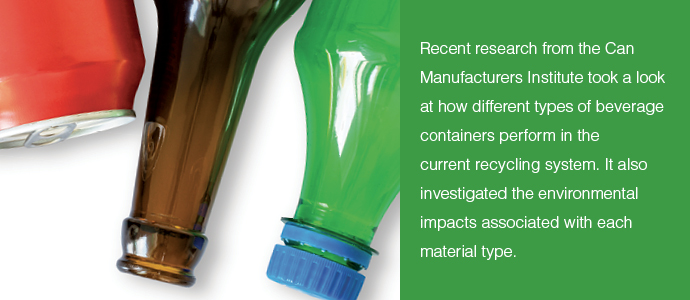
As policymakers look for ways to transform the U.S. recycling system, it is important to look at which beverage containers perform best in the current recycling system, as well as at which beverage container provides the most opportunity for reduced environmental impact in the recycling system of the future. A rigorous analysis found that the aluminum can has the highest “circular performance” in the U.S. recycling system today and provides the greatest carbon emission reduction potential in a variety of future recycling system scenarios.
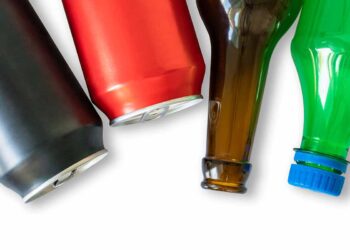
The Can Manufacturers Institute (CMI) commissioned the report, “Recycling Unpacked: Assessing the Circular Potential of Beverage Containers in the United States,” that circular economy consultancy Metabolic conducted. The purpose of the report is to help all stakeholders understand how different beverage packaging types – aluminum cans, glass bottles and plastic PET bottles – flow through the current U.S. recycling and waste system and which beverage packaging has the highest circular potential. The report is full of new data visualizations and insights. This article will offer some highlights from the research.
From recycled content to new container
Recycled content is an important consideration when analyzing circular potential because it determines how much of a beverage container’s virgin material use can be displaced from the production system. The report looked at both current recycled content numbers and theoretical recycled content limits for each container type.
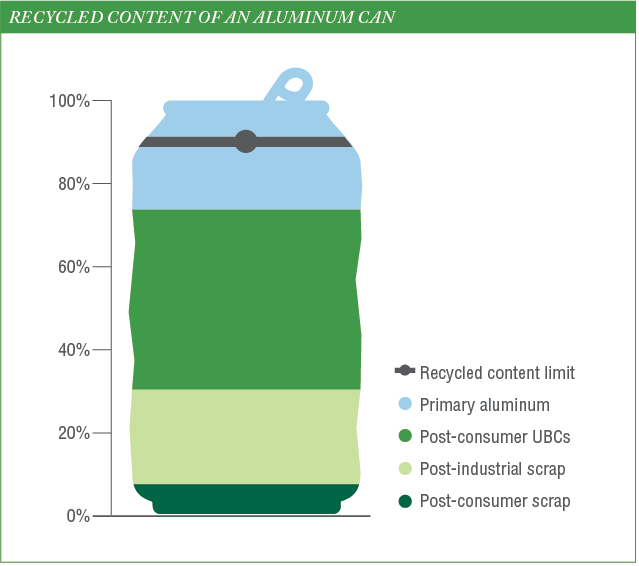
Today’s aluminum can has higher average amounts of recycled content than today’s glass and plastic PET bottles. The U.S. aluminum beverage can averages 73% recycled content from a combination of post-consumer and post-industrial scrap, while glass bottles average 27.5% and plastic PET bottles average around 6%. The aluminum can’s high recycled content is enabled by the use of an alloy that can incorporate significant amounts of recycled material, by a high recycling rate that leads to more available recycled material and by an efficient recycling process.
The report found aluminum cans also have the highest theoretical recycled recycled content limit: 90%.The glass bottle recycled content limit varies by color since each can tolerate different levels of color contamination. Green glass has the highest recycled content limit at 90%, and clear (flint) has the lowest at 60%
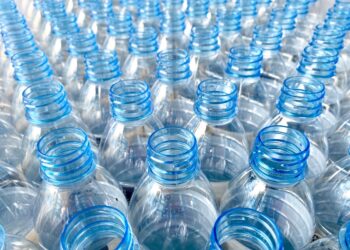
The PET bottle recycled content limit varies by type of collection system because contamination in the mechanical recycling process over multiple cycles changes critical PET properties such as haziness, yellowing and migration of volatile compounds. The highest theoretical recycled content limit for PET bottles is under a mono-collection system such as a deposit system (midpoint: 72%) and the lowest is with more contaminated co-collection systems such as certain single-stream recycling programs (midpoint: 43%).
Production: Identifying hotspots
Each beverage container has impact hotspots for energy, water and greenhouse gas (GHG) emissions, but where in the product’s lifecycle these hotspots are located determines whether recycling can offset these impacts.
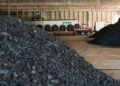
Aluminum beverage cans have the most significant energy, water and GHG impacts in the production phase, which involves transforming bauxite ore into usable aluminum ingot. As a result, higher recycled content leads to a significant reduction in the environmental footprint because primary aluminum production is avoided. In fact, producing recycled aluminum requires 90 to 95% less energy than virgin aluminum production.
In contrast, glass bottle manufacturing accounts for most of the glass bottle’s environmental footprint, which means recycling glass bottles has comparatively less impact reduction savings. The high intensity of natural gas and fuel oil used in glass furnaces accounts for 82% of total GHG emissions. Greater use of recycled material does little to reduce the energy use from the furnace. For every 1% of recycled glass cullet added to primary glass, there is only a 0.4% reduction in energy requirements in the manufacturing stage. This is why the report emphasizes reuse as the best circular strategy for glass bottles.
With PET plastic bottles, recycled PET bypasses the impacts associated with raw material extraction and resin production, but the manufacturing impacts for injection and blow molding remain the same.
Ultimately, when increases in recycled content are modeled across product life cycles, the aluminum can shows the greatest impact variability across global warming potential, cumulative energy demand and water depletion potential.
Tracking the flow of containers
A material flow analysis (MFA) was conducted to elucidate how each of the three beverage containers move through the current U.S. system. This analysis demonstrates how each material is currently being collected, processed and recovered, highlighting the key system leverage points that can either accelerate or inhibit reaching a circular state.
The MFA provides a deeper dive than recycling rates, accounting for critical variables such as the amount of material lost in the sorting and recycling process and whether there are high-quality secondary markets for the recycled material. The MFA also splits collected materials between those collected through deposit systems and those collected through efforts such as single-stream recycling programs so that the amount of material and ultimate use of the material from each kind of collection system can be examined.
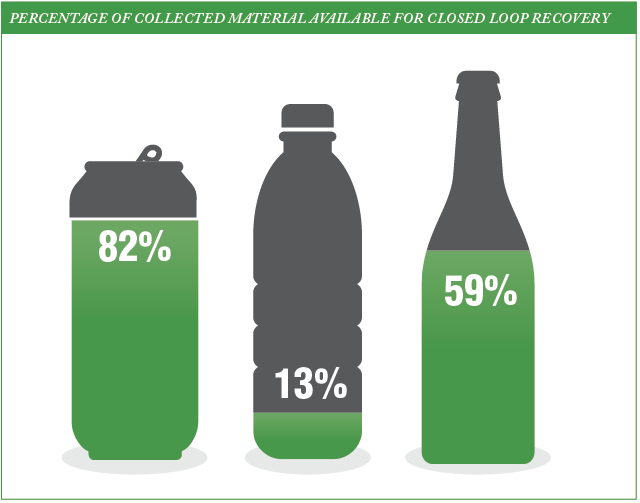
The MFA used several publicly available data sources with a focus on 2017 since that was the most recent year for which data was available for each beverage container. It shows that aluminum cans have the highest circular performance in the current U.S. recycling system. For instance, an MFA scaled to market mass reveals that nearly 82% of used beverage cans (UBCs) entering the U.S. recycling system were available for high-quality closed-loop recycling, compared with 59% for glass and 13% for PET.
Once beverage cans enter the recycling system, the largest material losses occur in the sorting stage at material recovery facilities (MRFs). Separate research that CMI released earlier this year found up to 25% of UBCs can be missorted into other material streams or lost in the sorting process (that study is called “Aluminum Beverage Cans: Driver of the U.S. Recycling System”).The focus of this research was on the economic impact of UBC missortation at MRFs, which reinforces the importance of correctly sorting UBCs. Further, CMI recently announced a grant program funded by Ardagh Group and Crown Holdings for additional aluminum can capture equipment (such as eddy currents) in MRFs.
The MFA shows that with glass, high quality recycling is dependent on the collection system. Nearly all (97%) of the glass recovered through bottle deposit systems can be used for high-quality purposes, whereas on average only 40% of the glass collected in single-stream recycling systems is recovered for high-value reuse. Of the remaining glass collected in single-stream recycling, 40% is typically used as landfill cover and 20% is downcycled as an additive in construction processes.
The difficulties associated with glass recycling highlight the importance of prioritizing localized and robust systems for glass bottle reuse, rather than recycling. Reuse systems are the best way to maximize the true circular potential of glass bottles, as long as the system is designed in a way to minimize emissions from transportation and distribution logistics.
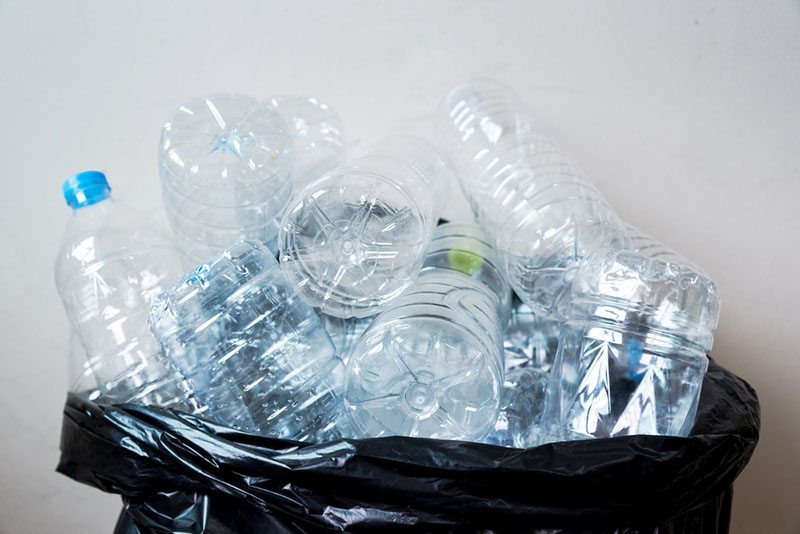
With PET, the MFA found an astounding one-third of material is lost during the mechanical recycling process. Of the 67% of material recovered, 21% is used for food-grade purposes such as bottles, with the remaining 79% used to create materials such as polyester fibers for clothing.
Opportunity for environmental impact reduction
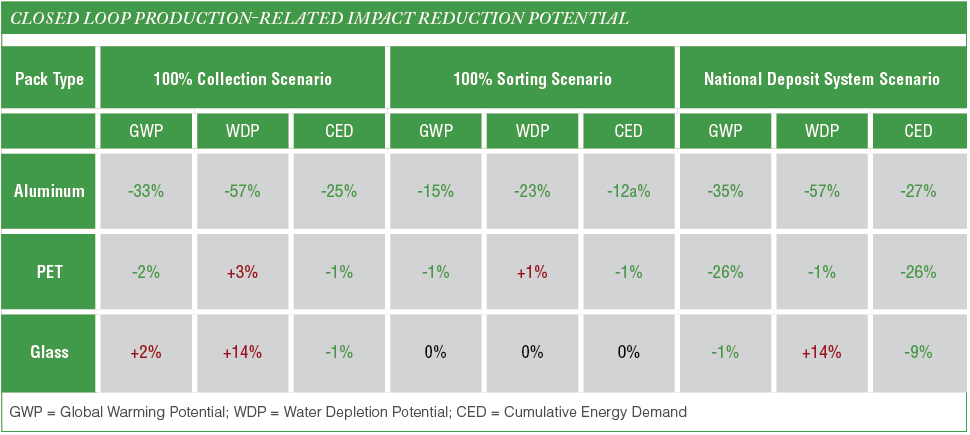
With the design, life cycle and MFA information, Metabolic modeled the emission reduction potential in three future scenarios for U.S. recycling systems: 100% collection, 100% sortation and a national deposit system.
This is an important exercise since policymakers, brands, nonprofit organizations and others are more closely examining the deficiencies in today’s U.S. recycling system and thinking about how to create an enhanced structure. As greater access and infrastructure is instituted, beverage brands and consumers need to understand which beverage container is generating the most significant environmental impact.
Metabolic calculated the emission reduction potential by connecting the impact assessment and MFA through a dynamic model, showing the impact reduction of increased material recovery over time. The model calculates the point in each scenario where the closed loop (container to container) recycled content “saturation point” is met for each material type. Once the closed loop limit was met, the model assumed the materials would be used for “open loop” applications – essentially, those other than container manufacturing.
The dynamic model shows that aluminum cans are the only packaging material with life cycle environmental improvements across all indicators and scenarios for closed loop and open loop recycling (see table below). This is due largely to the impact savings of recycling aluminum far outweighing the costs of primary aluminum production, aluminum having minimal processing losses, aluminum cans having a high recycled content limit, and aluminum being able to be recycled over multiple recycling loops.
In the collection scenario, much of the environmental savings from increased PET and glass collection from curbside systems are largely canceled out by increased reverse logistics and transportation-related impacts.
The national deposit system scenario provides the largest potential for high-value material recovery and maximum impact reduction for all packaging types. Still, if a 100% deposit collection rate was achieved, the total emissions impact reduction potential for recovering 1 metric ton of aluminum cans would be three times higher than that of PET bottles and 42 times higher than the impact reduction potential for glass bottles.
Overall, the environmental savings for glass recycling are minimal compared to the other packaging types with emission reductions only occurring in the national deposit system scenario.
Recommendations to move toward circularity
Increased collection rates and a national deposit system won’t achieve a circular economy alone. Business models and collection incentives need to be aligned for each material type, given their different life cycles and properties.
For aluminum cans, MRFs should invest in additional eddy current technologies and quality control robots to ensure all aluminum cans that enter the recycling system are sorted correctly for recycling. Aluminum can manufacturers could also examine how to separate during the recycling process the two alloy types used in aluminum cans. This separation has the potential to minimize the need for primary aluminum to rebalance the alloy composition in remanufacturing.
The path to circularity for glass is a shift from recycling to reuse. Glass bottles can be washed and refilled up to 25 times before needing to be recycled, which displaces the need to harvest valuable raw materials such as silica and soda ash for glass production.
PET poses challenges for circularity as its material properties degrade when it is recycled, and it relies on clean material streams for high quality material reintegration. Achieving food-grade quality recycled PET is complex, which is why the percentage of collected PET that is currently converted back into new beverage bottles sits at just 13%. To improve circularity for PET bottles, beyond advocating for bottle deposit systems, PET bottle producers should also invest in energy-efficient chemical recycling technologies and critically assess the life cycle impacts of these processes, shifting toward renewable sources of energy if impacts are high.
Regardless of material type, it’s important to remember the solution is not simply to rely on increasing levels of recycling. Recycling represents one part of a larger system that needs to work properly to maintain a functioning circular economy. Products need to be designed for circularity, incentives need to be put in place for high-quality and pure material recovery, and value chain partners need to collaborate on everything from reverse logistics to the creation of a robust market for secondary materials. These changes require a broader systems transformation and the adoption of different metrics, such as material displacement, to track progress more accurately on the journey toward a circular economy.
This recent research from CMI and Metabolic advances the circularity conversation around beverage containers with its data-driven analysis of today’s U.S. recycling system and of future, idealized recycling system scenarios. Its findings support the conclusion that consumers, policymakers, brands and other key stakeholders looking for the beverage container that has the highest circular performance in today’s U.S. recycling system and offers the highest emission reduction potential in the recycling system of the future should consider the aluminum can.
Scott Breen is vice president of sustainability at the Can Manufacturers Institute (CMI) and can be contacted at sbreen@cancentral.com. James Souder is a sustainability consultant at Metabolic and can be contacted at james@metabolic.nl.