This article originally appeared in the December 2017 issue of Resource Recycling. Subscribe today for access to all print content.
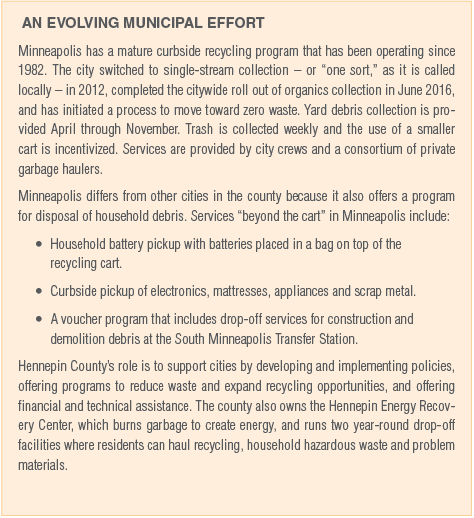
Hennepin County, which includes Minneapolis and 43 other cities, has a goal of recycling 75 percent of its waste by 2030. The county adopted this target to align with the goal established by the Minnesota state legislature for metropolitan counties. In an effort to increase recycling and make progress toward that goal, the county has in recent years expanded existing recycling programs and implemented new initiatives.
But county officials have also realized they needed a more detailed understanding of what was still ending up in the residential garbage stream. Such information would allow leaders to make more informed policy decisions on waste diversion possibilities – and it would offer insight into whether the 75 percent target (which is far beyond the 34 percent national recycling rate reported by the U.S. EPA) is even possible.
To help on this front, the county last year contracted with Foth Infrastructure & Environment to conduct a residential trash sort in partnership with the city of Minneapolis. The effort, which included a second sort that grouped materials into a number of detailed categories, has allowed the county to identify some of the biggest opportunities and challenges when it comes to increasing diversion.
Study objectives
This study focused on residential trash from Minneapolis, investigating trash loads from three different neighborhoods during one week in May 2016. The initiative took place shortly before a citywide rollout of curbside organics service.
The three selected neighborhoods represented the diversity of the city and shared characteristics with other cities in the county. Each load represented approximately 400 single-family dwelling units. The county’s consultant, Foth, worked with MSW Consultants, Louis Berger and Associates, and GRG Analysis to design and implement the waste sort.
Waste was sorted in two ways during the project. The primary sort, which was similar to waste studies conducted by the county in the past, grouped material into 10 categories: construction and demolition debris, electronics, glass, household hazardous waste, metal, organics, paper, plastic, textiles, and other waste.
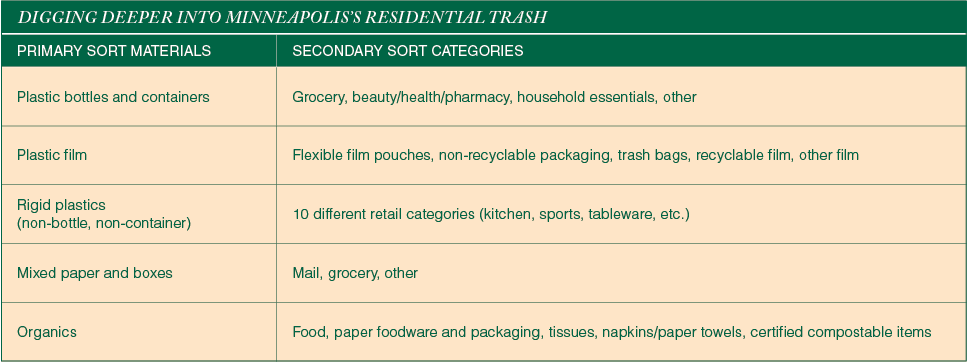
The secondary sort provided an additional layer of detail by classifying materials by “retail origin” or material sub-type. Sorting by retail origin explained where the product would be found in a department store, a useful categorization for determining where the item may have been used in the home by the resident. Sorting by material sub-type, meanwhile, simply dug deeper into the composition of a particular waste stream – for example, breaking down plastic film in separate categories including flexible pouches, trash bags and recyclable film.
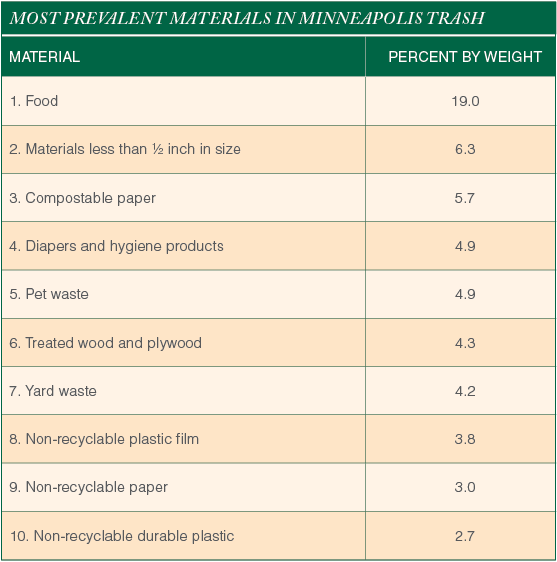
The goal was to create a more meaningful description of what’s in the trash to help explore how waste is evolving, where waste is being generated in the home, and whether or not some of these items are potentially recyclable. The table above offers more details on the secondary sort categories.
As the table above shows, food proved to be the most prevalent material in the trash by far (in terms of weight), which is consistent with the findings of other studies. Very small material fragments were second-most-prevalent, and compostable paper ranked third. Interestingly, there were no traditional recyclables such as plastic bottles or OCC in the top 10.
In fact, viable recycling or reuse options do not exist for seven of the 10 materials that were shown to be the most dominant trash elements. Food, compostable paper and yard waste were the only of those categories that lend themselves to materials recovery at this time.
The study found that reaching a 75 percent residential recycling rate goal would require diverting 100 percent of traditional curbside recyclables as well as recovering 100 percent of the following materials: appliances, construction and demolition debris, electronics, mattresses, organics, recyclable plastic bags and film, scrap metal, textiles and yard debris.
Given the obvious technical and practical constraints of recovering 100 percent of everything that can be recycled, meeting a 75 percent recycling rate goal in the residential sector is not realistically possible within the current system.
Nonetheless, clear opportunities exist to recycle more and reduce landfilling.
Looking closer at the stream
The potential avenues for recovering more were better illuminated via the waste study’s use of secondary sorts.
In this effort, plastic bottles and containers were sorted into four retail types. Almost 75 percent of all plastic bottles and containers were found to be grocery-related items, which indicates the waste was generated in the kitchen. Approximately 20 percent of plastic bottles and containers were classified as beauty, health and pharmacy items – or as “household essentials.” These items were likely generated in the bathroom or laundry room. The county’s Recycle Everywhere campaign has encouraged people to focus on correctly diverting items used in bathrooms and laundry rooms in addition to products typically found in the kitchen.
Plastic film was sorted into five different categories in the secondary sort, and researchers determined most of the plastic film in the trash was not recyclable. More than half of the plastic film was non-recyclable packaging, although only a small fraction was flexible film packaging. An additional 20 percent was trash bags. Recyclable plastic bags and film accounted for 16 percent of the total film in the trash. It should be noted, however, that it’s possible the weight (and corresponding prevalence) of plastic film was overstated because of moisture and particulate contamination.
There were some plastics that were not classified as bottles, containers, or film. Those miscellaneous plastics, referred to here as rigid non-container, non-bottle plastics, were sorted into 10 retail categories. There was wide variation in the retail origin.
On the fiber front, mixed paper and boxes were sorted into three categories: mail, grocery item and other. About 25 percent was mail and 25 percent was grocery related. Over half originated from other sources, such as packaging for bathroom items or toys.
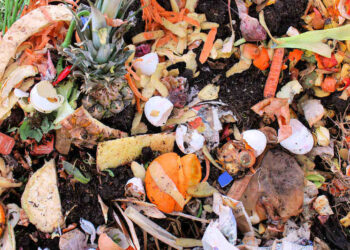
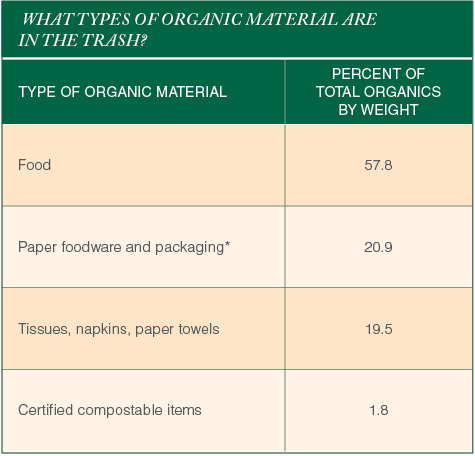
Digging into the organics segment, researchers found nearly 60 percent of the category to be food. However, compostable paper items (such as paper plates) and low-grade papers (such as tissues and napkins) also made up a sizable portion of trash. Very little certified compostable foodware was found. Yard waste was not included in the table below because it is managed separately.
Moving forward
With organics accounting for 19 percent of the trash tonnages, it’s clear the organics category deserves attention from city and county planners.
Minnesota state statute requires counties in the metropolitan area to prepare master plans every six years to identify strategies that meet the state’s recycling goals and objectives. Hennepin County recently updated its 2018 Solid Waste Management Master Plan with a focus on organics. The county is moving forward with four key strategies to increase organics diversion:
- Require businesses that generate large quantities of food waste to implement diversion of that waste by 2020.
- Require cities to provide residents the opportunity to divert organics by 2022.
- Develop infrastructure to support organics recovery, including the expansion of the county’s transfer station and involvement in expanding processing capacity such as anaerobic digestion.
- Reduce food waste through a number of initiatives.
 Reducing the amount of waste generated in the first place is also an impactful waste management practice that is grabbing more focus in jurisdictions around the country. A wide range of steps can be taken when it comes to prevention. Simple recommendations that municipalities can make to residents include the following:
- Avoid single-use, disposable items and use reusables instead.
- Choose products with less packaging.
- Remove yourself from unwanted mail lists.
- Sell or donate stuff you no longer want.
- Buy used items.
- Purchase goods that are of high quality and built to last.
- Borrow, rent or share instead of buying your own.
Hennepin County has also launched an initiative called Zero Waste Challenge to help encourage the local population on waste reduction, and its first pilot project started in September of 2016 with participation from 35 households. Overall, participating households decreased the amount of waste they produced by 20 percent. On average, households recycled or composted 62 percent of their waste, significantly more than the countywide diversion rate of 45 percent. About half of the households started composting their organic waste due to the challenge.
The country’s waste study showed that progress can be made by continuing to analyze what’s being put in the garbage stream and then taking action. But with proper recycling behavior clearly engrained in the habits of many residents, taking steps toward greater waste reduction may be the most impactful way to make a material difference.
Ben Knudson is a recycling specialist at Hennepin County Environment and Energy Department. He can be contacted at [email protected]. The entire study detailed in this article is available at hennepin.us/solidwasteplanning.


