


This article originally appeared in the December 2015 issue of Resource Recycling. Subscribe today for access to all print content.
Since the 1990s, curbside and drop-off recycling has grown substantially – nearly 90 percent of households now have access, according to recent surveys from Moore Recycling Associates, the American Forest and Paper Association and others.
Unfortunately, public space recycling has not kept pace. Recycling options are woefully insufficient in parks, malls, streetscapes and other civic and communal locations. Much of this is the result of limited infrastructure, mostly collection bins, for on-the-go recycling. A study from Keep America Beautiful in 2009 concluded only 12 percent of public spaces have recycling bins.
While recycling is one of the easiest environmental behaviors to adopt, insufficient access to recycling bins is still the primary barrier when it comes to public space recycling. To improve convenience – and ensure “correct” recycling – providing the correct bins is fundamental.
Not all bins, however, are created equal. Some bins are easily recognized as recycling receptacles, and others are presumed to be for trash only. And when it comes to labeling bins, the average person may be woefully confused about the terminology employed by experts. To better understand which features make a recycling bin recognizable to the public, George Washington University and Keep America Beautiful partnered to conduct an online survey, completed in 2014. The survey gathered data about how recycling bin shape, color and labeling can influence recycling behavior and participation.
Bin shape: corners vs. round
To rate recognition of bin shape as it relates to disposal method, photos of bins in the same color were shown to survey respondents. They were asked to select shapes they associated with “recycling,” “compost” and “trash” (see Figure 1).
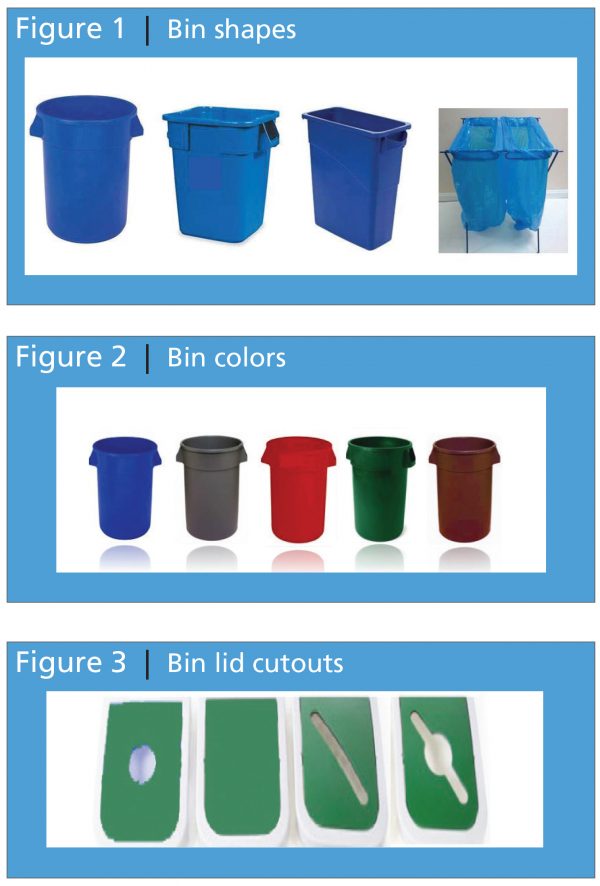 In general, the results show that while there is more variety in bin shapes identified as recycling, there is also a greater chance of confusion. Specifically, the survey found:
- Round bins are most often identified as “trash.” More than half (56 percent) of survey respondents identified a round bin as one designated for garbage. The rectangular shaped bin was most frequently identified as a recycling bin (56 percent). However, roughly one-third of respondents also identified the wireframe (37 percent) or square (35 percent) bin shapes as recycling containers.
- Bins with corners are most identified for “recycling.” What differentiates a trash bin from a bin for recycling? More than half of respondents identified a bin with corners (either square or rectangular) as a recycling bin.
- Bins for “compost” are least identifiable. No shape was recognized as a compost bin by more than one-third of respondents, suggesting that bin shape is not currently an important factor in recognizing a compost bin. The results may also indicate compost bins are not common enough to be associated with a particular shape.
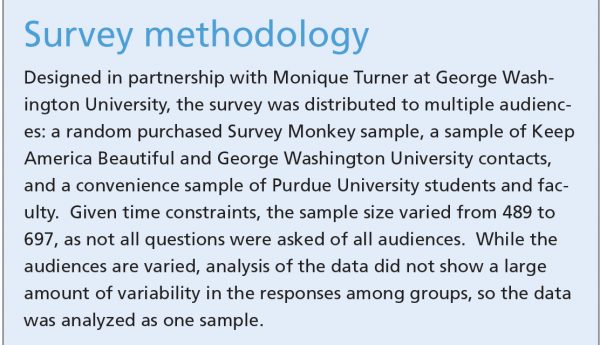
Consistent results for bin color
Earlier research has suggested that for trash, recycling and composting bins, colors can be used to communicate the intended use of a bin (source: Montazeri, Gonzalez, Yoon, & Papalambros, 2012). To test this finding, survey respondents were shown the same bin in five different colors and asked to select the colors they associated with the each bin type – recycling, trash and compost (see Figure 2). Survey findings were fairly consistent:
- Gray bins were most identified as “trash.” The gray bin was cited by
78 percent of respondents as a garbage bin, with brown a distant second (24 percent). - A large majority consider blue bins “recycling.” Blue bins are most frequently identified as recycling (79 percent). At the same time, 39 percent associated green with recycling.
- Brown and green bins hit the mark as “compost.” Survey respondents were least certain about the color of a compost bin, but about half selected brown (51 percent) or green (41 percent). Brown was also associated with trash for many respondents, suggesting green may be the most appropriate color for compost.
Lids point way for recycling
To identify whether a particular lid design affects perceptions and behavior, survey respondents were shown pictures of various bin lids, each with a different cutout shape and one “lift” lid (one that had no cutout). Figure 3 shows the lid images used in the survey. Respondents were asked to match each lid type with one item from a set of materials – plastic water bottle, newspaper, banana peel, glass beer bottle and candy wrapper.
The results suggest that people have a fairly consistent understanding of what some lids have been designed to collect:
- Lids with a circular cutout were most often associated with “round beverage containers.” The majority of respondents associated a circle with plastic (81 percent) and glass (66 percent) bottles.
- A clear majority identified a slit cutout as an indication of “paper.” A long, narrow slit was associated with newspapers by 81 percent of respondents.
- A circle/slit combination was not straightforward. A lid with both a circle and a slit was associated with plastic by 56 percent of respondents, but glass (51 percent) and newspapers (54 percent) were also often listed as associations.
- No cutout means no clear material association. The bin with no opening on the lid was most associated with trash.
“Mixed recycling” best for all recyclables in one bin
Because the industry has seen such clear growth in single-stream recycling, in which all recyclables are placed in one bin, the survey asked respondents about their understanding of the terms “commingled,” “single-stream” and “mixed” recycling. Results suggest that signage should employ the term “mixed” to indicate placing all recyclables in one container.
Respondents were split on whether these terms all carried the same definition. The 52 percent of survey respondents that did not think these terms were the same were asked to define what they thought would go in a bin labeled with each term. Over three-quarters (77 percent) of the subset of respondents said “mixed” recycling indicated that all recyclables can go in the same bin. Meanwhile, 61 percent of the subset said “commingled” meant all recyclables could go in and only 11percent associated “single stream” with that action.
Potential for confusion in bin signage
To gauge the effectiveness of different features of bin signage, survey respondents were shown five labels and asked to choose which materials they were certain could be placed in a bin with that label (see Figure 4). For simplicity, the survey focused solely on recycling, rather than compost or trash bin signage.
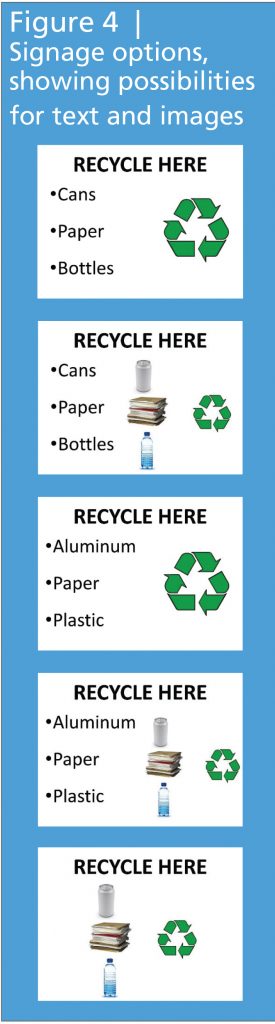 It’s always assumed that images help clarify recycling signage, but the survey found that the use of photos is far from straightforward and raises the need for further research. For example, showing images of one material example may cause some uncertainty about the recyclability of items not shown. Furthermore, images with no text may amplify the confusion of what should be put in the bin. It is important to note that the images used in this research were commonly recyclable materials, and images of uncommon or more confusing items may have had a different effect on understanding.
Labels with words and no images showed the strongest results. For “always recyclable” materials, the survey showed signage with the best results uses the words – cans, paper and bottles – and no images. A majority of respondents (over 85 percent) recognized soda cans, soda and water bottles and newspapers as recyclable without an image.
Word choice influences individuals in different ways. Over 80 percent of respondents understood that soda cans as well as water bottles were recyclable for all signage conditions. But, for example, the word “plastic” pushed respondents to believe non-recyclable plastic items, such as plastic bags, could be put in the bin. In addition, the word “bottle” caused respondents to think of both plastic and glass. When the word “bottle” was present with no image, over 80 percent of respondents said they would recycle it. Yet, when an image of a water bottle was present, only 40 percent indicated they would recycle the glass bottle.
The use of images alone may decrease recycling. For some materials, using just an image of a commodity may decrease the recycling of that item. For paper bags, for instance, when there was no image (just words), 80 percent indicated they would recycle the paper bag. But when a mixed paper image was shown (no words) there was a 25 percentage point decrease in the number of people that said they would put the bag in the bin. In regards to a soda bottle, when only words were used, nearly 90 percent indicated they would recycle the item. But when a water bottle image was shown, just 65 percent of people said they would divert the plastic soda container.
Next steps: expanding on results
Survey findings indicate the need for consistent, research-based recycling messaging and intentional bin selection to improve recycling participation as well as decrease contamination. To build on survey outcomes, Keep America Beautiful is focused on two public education initiatives that will establish a more favorable return on investment from recycling programs.
The first of these is Keep America Beautiful’s efforts with a number of national and state organizations, as well as the U.S. EPA, to embark on research that will explore developing a recommendation for a standardized color, shape and size for organics/compost diversion bins.
Keep America Beautiful is also partnering with Purdue University’s Office of Sustainability to complete in-the-field research around recycling messaging, including the use of icons and targeted words. The study will investigate barriers around specific recycling behaviors and identify models for improved recycling on campuses and other public spaces.
Brenda Pulley is senior vice president, recycling at Keep America Beautiful. Kelley Dennings and Kaitlin Phelps are both formerly with Keep America Beautiful.
For more details on the Keep America Beautiful survey reported in this article, download “Public Space: Recycling, Composting and Trash Bin Design and Signage,” a KAB best-practices guide for designing public space recycling bins. That guide and other public space-related case studies, templates, behavior studies and resources are available at americarecyclesday.org/public-space-recycling-resources.