







This story originally appeared in the January 2017 issue of Resource Recycling.
Subscribe today for access to all print content.
To reduce MSW management costs, local governments have traditionally focused on two primary approaches: using the lowest cost disposal and encouraging recycling. Yet neither of these approaches reduces the generation of MSW, which is done through source reduction and reuse.
While state governments have the option of promoting source reduction or shifting post-consumer management costs to product manufacturers through expanded producer responsibility laws, local governments cannot. Local authority to reduce the generation of MSW is limited by state and federal constitutional restrictions on flow control.
However, cities and counties have found one way to exercise some power on source reduction: They can pass ordinances that mandate the reduction of certain consumer products. And as readers are likely well aware, two types of plastic products have increasingly been subject to this type of municipal action – plastic shopping bags and single-use polystyrene foam used for food service.
This article will focus specifically on the polystyrene part of the trend. According to my research, as of December 2016, there were 148 local ordinances in the U.S. specifically addressing expanded polystyrene food-service products. These ordinances covered 6.8 percent of the U.S. population.
Of interest is that 63 local governments that adopted these EPS ordinances also adopted ordinances on single-use shopping bags.
For a material to be targeted by a waste-reduction mandate, it will generally meet one or more of the following criteria:
- Generation of the waste is constant and routine.
- At end of life, the material is problematic because it is costly
to recycle or is not recycled. - The material has been deemed a significant cause of local environmental impacts (it may contribute to litter, for example, or impede stormwater management).
- As a product, the material is not essential to public safety, security or health.
- Viable and environmentally preferred substitutes for the material exist.
Polystyrene (labeled No. 6 in the plastic resin identification code) is a petroleum-based plastic derived from styrene. Molded polystyrene is used to create rigid materials including take-out cup lids, salad bar containers, and disposable cutlery. Extruded polystyrene is used primarily as trays for meat, poultry, fish, deli products, and produce and used for egg cartons. Expanded polystyrene foam is used to produce hot and cold beverage cups, bowls, plates, clamshell hinged containers and trays.
These items are commonly used by restaurants, snack bars and food trucks as well as cafeterias in schools, hospitals and soup kitchens. Correctional facilities and home meal delivery programs for seniors are also common venues for the products.
For EPS food-service items, government action has been sparked by a combination of issues: a lack of viable recycling opportunities; its contribution to land, surface water, and marine litter; and its impairment of stormwater management systems.
Contamination and expenses
The lack of economically feasible recycling options means that for most local communities, all discarded EPS must be landfilled or burned. Both Los Angeles County and the Canadian province of Ontario, for instance, have estimated their EPS food-service recycling rates are about
1 percent.
The reason for the low rate is simple economics. Being about 95 percent air, EPS is extremely light (weighing about 9.6 pounds per cubic yard) and thus very expensive to haul. It also has a low commodity value because it is “downcycled” (sent to markets such as picture frames instead of new food-service products). Further eroding its value is the fact that the material is often contaminated with food or dirt.
For local governments, the cost to remove food-service EPS from mixed recyclables collected at curbside is high because the foam plastic is problematic to segregate – and can break apart into small pieces, which makes sorting extremely difficult and costly. To maximize EPS’s commodity value, a separate collection/drop-off system would be required, and this would also necessitate densifying to reduce hauling costs. A limited cost analysis conducted by Sedona Recycles, a nonprofit recycling operation in Arizona, found a net loss of $725 in recycling an 837-pound pallet of recovered EPS, primarily because of the labor involved in densifying the material.
To summarize, food-service EPS is difficult for many municipalities to handle because it is generated in small quantities at multiple locations, it is costly to segregate and haul, and it carries a low commodity value.
Adding to the anxiety of local government is the fact that EPS can also be a source of litter due to the very properties that make it a valuable insulating product – it’s lightweight and composed mostly of air. The material can easily move from land to surface water to the ocean via storm drains, wind and overland stormwater runoff. Its persistence coupled with its buoyancy means it is a significant cause of marine litter. And, because it’s so lightweight, EPS easily becomes “fly away” litter all throughout the chain of proper collection, hauling and disposal.
 How much material is generated?
The exact amount of food-service EPS being sent into the waste and recycling stream is a big unknown. Figures on per capita consumption of the material and its disposal are hard to come by, but there are some estimates. A 2009 report prepared for the American Chemistry Council concluded that in 2004, Americans consumed 56.73 billion EPS cups, bowls, plates, clamshells and trays, which equated to 193.2 items per person per year. The ACC report found in 2008, consumption increased slightly to 59.04 billion units or 194.2 items per person per year.
San Jose, Calif., meanwhile, has completed an analysis based on North American production data and estimated a range of 1.8 to 7.0 pounds of food-service EPS usage per person per year – to contextualize those numbers, consider there are about 103 12-ounce EPS cups in a pound. Using waste characterization studies, San Jose found the 2008 per capita disposal rate of food-service EPS to be 5.3 pounds.
The California communities of Mountain View and Sunnyvale also conducted a waste characterization analysis in 2010 and estimated the per capita disposal rate of the material to be 6.4 pounds per person per year. These estimates were similar to the 2015 New York City disposal rate, estimated at 6.0 pounds per person per year. A problem with disposal rate figures, however, is that they do not include material that became litter during and after use.
How local governments have responded
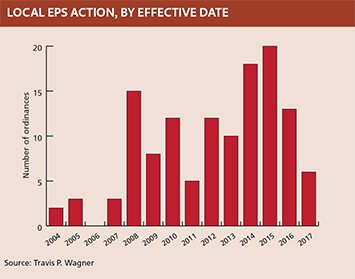
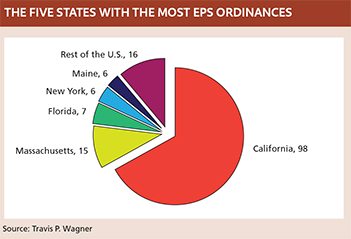
As noted, there are now 148 local governments – counties, cities and towns – in 15 states, including the District of Columbia, that have adopted ordinances to reduce or eliminate the consumption of food-service EPS.
America’s first food-service EPS ban was adopted on March 29, 1988 by New York’s Suffolk County, and it was followed by a similar ban adopted by Berkeley, Calif. on Oct. 11, 1988.
Between 1988 and 2004, 18 ordinances were adopted. Most of the initial bans came out of concerns over the use of chlorofluorocarbons (CFCs) to produce foam products and the role of CFCs in depleting stratospheric ozone. CFCs are no longer used to produce EPS, but nevertheless the number of ordinances began to increase in 2004 and especially in 2008, following San Francisco’s 2007 ban.
The ordinances can be divided into two categories: indirect bans and direct bans. An indirect ban does not specify EPS, instead mandating, for example, that only containers that are compostable or that are locally recycled are allowed.
Direct bans, on the other hand, can be rolled out in a number of different ways. A “narrow ban” affects only local government. For example, in this structure, material may be banned only at food-service outlets in government buildings, at government-hosted events, in public parks or at local public schools.
Another strategy is a “limited ban,” which applies to containers provided by food vendors (restaurants, grocery stores and food trucks) primarily for take-out or leftovers. A “full ban” covers the uses listed under limited bans but also includes use of polystyrene packaging for meat, poultry and produce as well as egg containers. The full ban approach makes a significant impact at grocery stores.
Finally, there is the concept of an “expanded ban.” This includes all the above bans but also may ban the retail sale of items outside the packaging realm. The strategy may cover items such as foam plastic coolers and the use or sale of plastic utensils, cups, lids and straws regardless of resin. The expanded ordinance could also restrict use of polystyrene foam “peanut” packing materials.
 Of the 148 ordinances, 5.4 percent currently are narrow bans in which EPS is restricted primarily at governmental facilities and public areas – it should be noted that some local ordinances started with narrow bans and have since expanded. In addition, in multiple jurisdictions, public school systems, which often operate as a somewhat separate authority within a local government, have imposed their own bans, primarily on single-use foam cafeteria food trays, and these policies are applicable only within the school system.
For example, EPS food trays have been banned and replaced with compostable-paper-based trays in the nation’s six largest school districts: New York City, Los Angeles, Chicago, Miami-Dade, Dallas, and Orlando.
Limited bans are the most frequently used local approach, accounting for 81.1 percent of all ordinances. Full bans account for 10.8 percent of the ordinances, and
2.7 percent of the ordinances are expanded bans. Expanded bans have been adopted primarily by shoreline communities, including Folly Beach, S.C.; Manhattan Beach, Calif.; and Miami Beach, Fla. They have also been implemented in communities in vulnerable watersheds, such as Montgomery County, Md.
What does the future hold?
Local ordinances are increasing in frequency, but there are attempts to block ordinances because of political and industry backlash. New York City has gone through a high-profile battle over a proposed ban, and the ordinance was ultimately rejected in court. And while multiple states have recently passed bans on local shopping bag ordinances (a “ban on ban” scenario), only one state thus far, Florida, has passed a ban on future local ordinances that specifically target EPS.
There is also the question of the tipping point. At what point does it make sense, politically or legally, to adopt a state-level law as opposed to a variety of local ordinances? While this approach has been pursued for single-use bags in California, the same cannot be said for food-service polystyrene.
As the number of local ordinances in the U.S. grows, another question also naturally arises: What single-use consumer products may be targeted next? As mentioned earlier, single-use plastic foodware and utensils have already been wrapped into some expanded bans. And Concord, Mass. several years ago adopted the first ban on the sale of plastic bottles containing drinking water.
Travis P. Wagner is a professor of environmental science and policy at the University of Southern Maine. His research focus is on solid waste management practices and policies and extended producer responsibility. He can be contacted at travis.wagner@maine.edu.