This article originally appeared in the March 2018 issue of Resource Recycling magazine. Subscribe today for access to all print content.
How do you get people to recycle more? What does it take to reduce contamination? How much more high-value recyclable material can be captured through curbside programs?
Now more than ever, recycling program managers are looking for answers to these questions, seeking ways to improve program outcomes and change recycling behavior. Traditional metrics and methods of measurement, such as weight-based diversion rates and waste characterization studies, have helped guide important advances in the field. But they fall short when it comes to figuring out the best way to move forward on today’s most pressing municipal recycling issues.
To better understand how effectively recycling programs are recovering recyclable material and how much more progress can be made, a new metric – the capture rate – and a new method of studying curbside diversion behavior is on the rise.
Measuring what matters: Capture rates and cart studies
Recycling programs have long measured their success using a recycling or diversion rate, calculated as the tons of material collected for recycling divided by the tons of all waste collected. The problem with this approach is that it doesn’t indicate how much of the waste stream is actually recyclable, making it difficult to discern how well a program is recovering recyclable material.
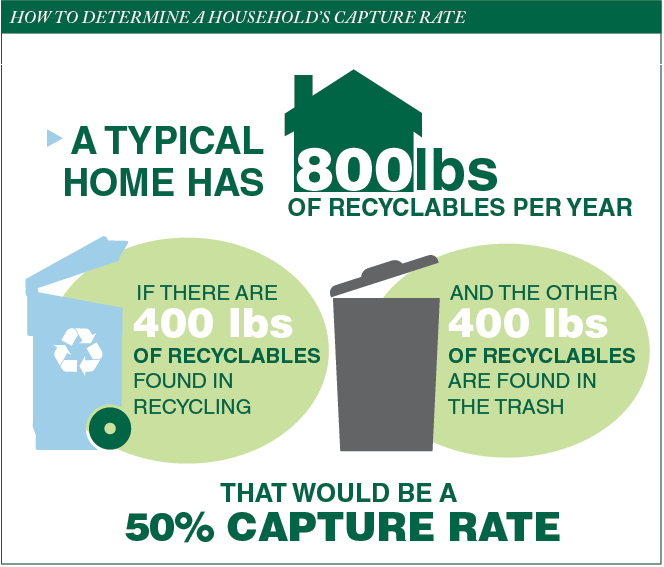
In contrast, a capture rate is defined as the weight of recyclable material collected for recycling (not including contaminants) divided by the weight of all recyclables in the waste stream. Capture rates can be calculated for individual materials or for the overall recycling stream. Capture rate calculations strip away all the other variations in the waste stream that can influence recycling rates, providing much greater insight into the state of a program.
 Capture rates can be calculated using tonnage data and conventional waste characterization data (provided that both disposal and recycling streams are characterized), but this approach only provides information at an overall level. To guide smart program design, you need more detailed information about recycling behavior at the level of individual households. The aim is to understand whether recyclables ending up in the garbage are coming from households that participate in recycling but could do better, or if they are coming from residents that do not recycle at all.
Meanwhile, to tackle contamination, you want to understand the make-up of the contamination and whether the sources of contamination are concentrated (a few really bad carts) or distributed (a little bit from every house).
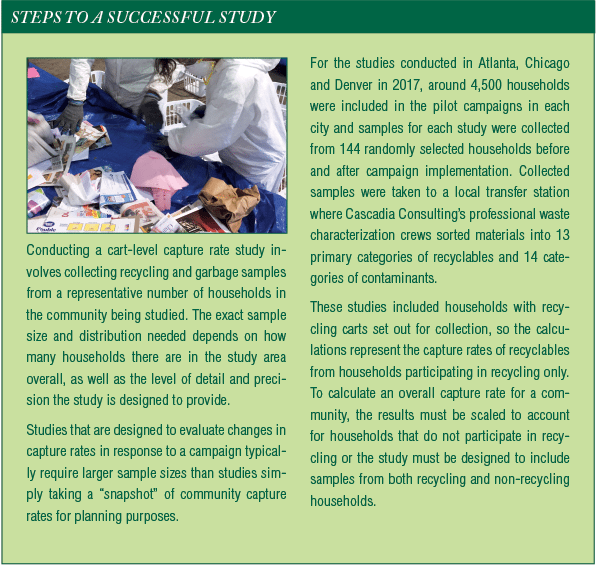
To answer these questions about how recyclable material is ending up in the trash and how non-recyclable materials are finding their way into the recycling stream, you need to conduct a more specific capture-rate study, one that is focused on curbside carts. This type of analysis allows you to see how much recyclable material is being generated, how much of it is making it into the recycling stream, and how much non-recyclable material is ending up in the recycling cart – all at the individual household level.
The household-level data then gives you the power to chart and track household behavior patterns, identify the areas of greatest opportunity for behavior change in your community, and understand the prevalence of lightweight “problem materials” (such as plastic film).
Perhaps most importantly, however, cart-based capture rate studies give program leaders a solid baseline for measuring the impacts of outreach campaigns and other efforts to boost recovery and decrease contamination.
In 2017, The Recycling Partnership, in collaboration with Cascadia Consulting Group, used cart-level capture rate studies to design, test and evaluate tailored campaigns to boost recycling and reduce contamination in Atlanta, Chicago and Denver. The stories from these cities help illustrate how cart studies and capture rates can guide programs with different needs and starting points to success.
Denver: Uncovering opportunities in cans
Colorado’s capital has a high-performing curbside recycling program. The annual recycling tonnage collected is over 500 pounds per household per year, well above the national average. But as in other high-performing communities, residential garbage in Denver still contains recyclable material. Staff members from the city and county of Denver were confident residents could divert more material but wanted to know where to focus their efforts.
A recently completed citywide waste characterization study showed that cardboard was the recyclable material that showed up in the highest quantity (by weight) in residential garbage, so Denver city staff and The Recycling Partnership initially set out to create an outreach campaign focused on increasing cardboard recycling among households participating in Denver’s purple cart recycling program. Cart-level analysis was scheduled to be conducted before and after the campaign to see how behavior changed in test areas along four collection routes.
But a deeper look at the stream caused the material focus to shift. In Denver, the goal was to get those households already recycling to recycle more. The waste characterization showed that cardboard was a large percentage of the recyclables in the waste stream by weight because it’s a heavy material and because the waste characterization study took into account those households that do not recycle. The baseline capture rate study, however, revealed that more than 80 percent of cardboard generated by recycling households was already being diverted. Thus, this material was actually not a good place to focus for this particular campaign.
Instead, it became clear metal cans were a more logical target. Among recycling households, nearly 40 percent of metal cans (both steel and aluminum) in the home were still ending up in the garbage, and another 8 percent were bagged in the recycling cart and weren’t being recovered.
Strategies to boost can recovery included a social media campaign, truck signage and a mailing effort in which simple postcards were sent to each home in the test area (nearly 5,000 households). Half of the households in the test area also received two rounds of tagging – cards were placed on garbage carts encouraging metal can recycling.
After 16 weeks (eight collection cycles) of implementing these strategies, The Recycling Partnership conducted another cart study to identify changes in recycling behavior and assess whether the strategies had an effect on metal can recovery. The study found particularly noteworthy upticks in aluminum can recycling, with a 25 percent increase in aluminum recycling among households that received general outreach as well as cart tags. It was further determined that the increase came from households that generate high volumes of cans, which will help inform future campaigns.
Using cart-level capture rate studies allowed Denver to better identify its greatest opportunities for improvement and to assess the impact of its outreach efforts. Building on the results of the pilot, the partners are now preparing to roll out the campaign citywide.
 Atlanta: Reducing tendency to bag material
From past waste audits and conversations with MRF partners, the city of Atlanta knew it had a contamination problem but also opportunities to lift overall recycling collection. Local leaders weren’t sure what to tackle first.
The baseline cart study performed by the city and The Recycling Partnership revealed that more than one-third of all material in residential recycling carts was not recoverable, with 19 percent non-recyclable contamination and an additional 17 percent of cart contents made up of bagged recyclables. Research into the local system showed that, similar to Denver, bagged loads in recycling carts were tossed off the line at the MRF and not recovered.
This information allowed project leaders to focus messaging around key contaminants and not bagging recyclables. The city aggressively targeted four test areas that included nearly 4,400 households. Lids were tipped, carts were tagged and contaminated carts we rejected. At the same time, recycling information was provided to residents through mailings and nearby signage.
In all, contamination in the test areas fell 57 percent. The general loose contaminants, such as food, textiles, yard waste, and “tanglers” (ropes, cords, hoses and other stringy items), fell from 19 percent of material in recycling carts to 10 percent (by weight).
The baseline information collected in Atlanta showed that 52 percent of the homes participating in recycling had recyclables in plastic bags. Eight weeks after the outstream strategy was first put in place, only 22 percent of the homes had recyclables in plastic bags. Recyclables in plastic bags went from 17 percent to 6 percent of cart contents, meaning more recyclables made it into carts loose and ready for recovery.
Furthermore, in the pilot areas, the overall capture rate of recyclables climbed from 52 percent to 66 percent. Material quality also improved.
The city of Atlanta now has the confidence to effectively and efficiently roll out the pilot project’s techniques citywide to drive down contamination and unlock valuable material lost through bagging.
Chicago: Zeroing in on contamination
Waste officials in the Windy City also knew contamination was a big problem for their recycling program. But it’s hard to tackle this issue without knowing the specifics of the contaminants. A cart study is the most robust way to get granular contamination information and track the effectiveness of outreach efforts to find out if contamination-focused messaging has the unintended consequence of increasing recyclables in the garbage.
Conversations with all three MRFs that process Chicago’s residential recycling, along with findings from a baseline cart study, revealed that loose plastic wrap and film, textiles, tanglers, food, and bulky items such as C&D were major contaminants, both by weight and by occurrence. This information helped program leaders design “oops” tags to focus on only these items, plus recyclables in plastic bags. Mailers, signage and cart tags were deployed in test areas around the city, and collection laborers (collection is entirely manual) in the test areas left tags on contaminated carts.
At the end of a 16-week study over eight collection cycles, the second cart-level capture rate study showed that contamination decreased 32 percent. Meanwhile, the capture rate held steady and a participation rate study showed that participation did not change, indicating that the techniques used did not discourage recycling. Analysis also found decreases in the volumes of four of the six contaminants targeted by the “oops” tag.
Completing a capture rate study has allowed Chicago to take the pulse of its curbside program and address specific contamination issues. The city is now poised to roll out proven tactics to all of the 630,000 homes it serves.
Guiding future investments
As the case studies outlined here demonstrate, cart-level capture rate studies can do much more than simply provide a profile of waste composition in a community. These data-rich analyses can help recycling program managers understand where opportunity lies to improve program outcomes. Cart-level capture rate studies can also be applied to study household behavior in “emerging” areas such as food waste and food scraps diversion.
When conducted before and after an outreach campaign or other program activity, cart studies can reveal how effective the program has been at changing household behavior, which in turn can better guide investments in programs that make a real impact. And capture rates can provide a metric for tracking community performance that better represents the extent to which recycling programs are achieving their goals – capturing as much recyclable material as possible for use in new production while driving down contamination.
We encourage all programs to dig into recycling performance by using capture rate studies and use the findings to take action and share the results. A toolkit that outlines the strategies used in these programs is available on the Tools section of The Recycling Partnership website. Additional techniques, tools and tips are always being added.
McKenna Morrigan is senior associate with Cascadia Consulting Group and can be reached at [email protected]. Cody Marshall is vice president of technical assistance at The Recycling Partnership and can be reached at [email protected].
The Recycling Partnership is a national nonprofit organization that applies corporate partner funding to improve the recycling system in cities and towns across the nation. For more information, visit recyclingpartnership.org.


 Atlanta: Reducing tendency to bag material