


This article originally appeared in the August 2017 issue of Resource Recycling. Subscribe today for access to all print content.
In recent years, many leaders in the waste and recycling industry have expressed commitments to moving to a sustainable materials management mode of thinking.
Government officials, CEOs, local program chiefs and others are enacting goals and making decisions about materials and methodologies that account for environmental impacts throughout the entire life cycle of a product.
The U.S. EPA’s “Sustainable Materials Management Basics” website offers the following example of how sustainable materials management (or SMM) might play out in the market: “A product may be re-designed so it is manufactured using different, fewer, less toxic and more durable materials. It is designed so that at the end of its useful life it can be readily disassembled. The product’s manufacturer maintains a relationship with its customers to ensure best use of the product, its maintenance and return at end-of-life.”
Clearly, progressing SMM in society as a whole will take coordination and comprehension among many different stakeholders. Now that many key players are talking about SMM implementation in their own silos, how do we help bring those commitments together and lift SMM on a national level?
In November 2016, the Sustainable Materials Management Coalition (SMCC) released a report offering some recommendations.The report, titled “Reducing the Environmental Impact of Materials Use,” expands on a key 2009 EPA analysis, “Sustainable Materials Management: The Road Ahead,” that articulated a national goal of reducing the environmental impact of materials – and doing so in a holistic, life-cycle-focused manner.
Last year’s SMMC document provides suggestions on how we can establish a framework for establishing that goal, offering three concrete action points:
- Measure per capita waste generation and recycling.
- Expand and clarify the important data and analyses in EPA’s annual “Facts and Figures” report.
- Reinforce at every level of government the life-cycle implications of policy decisions.
This article will offer a synopsis of the SMMC report, helping to show how a revamped presentation of recovery and disposal data can help the industry better align itself with the principles of sustainable materials management.
Using two metrics together
Too often, waste and recycling stakeholders have continued to focus on end-of-life management goals to the exclusion of other goals and metrics, unintentionally keeping the nation’s focus away from comprehensive life-cycle impacts. In the process, government officials and waste management companies have encouraged investments of time, money and other resources in activities that may not lead to the biggest environmental benefits.
Instead of this end-of-life focus, the EPA’s “Road Ahead” recommended creating national goals around reducing the environmental impact of materials use at every stage, including production, shipping, and final disposition. This effort can and should be supported by a continuum of practices, including, but not limited to, recycling.
In the SMMC report, we note that measurement practices are an important part of encouraging smart use of SMM across industries. And stronger measurement about materials usage can take place by tracking two specific areas.
The first is reduction in per capita generation rate (rather than reduced disposal rate). Reduced materials use is implicit in reduced generation, and by using less material overall, the environmental benefits can be pronounced. The second area of focus on measurement is increasing the recycling rate so that we avoid additional upstream impacts by providing feedstocks that industry can use to make new products.
While measurement of generation and recycling rates may seem like business as usual, using these metrics in concert to inform strategies that support a new, unambiguous goal of reducing the environmental impacts of the products we use moves us on the path from waste management to materials management.
Much of the data required for this enhanced measurement strategy is already available in EPA’s annual “Facts and Figures” report, which establishes important baseline statistics for materials management stakeholders. However, opportunities exist to expand “Facts and Figures” to more effectively support a more explicit SMM goal. Possibilities include providing new information and analyses, more robust explanations of the data, a more detailed accounting of the ultimate fate of “discards” from municipal solid waste (MSW), additional detail on the changing material distribution in MSW, information on alternate collection systems, and historical market data for recovered commodities.
For instance, U.S. per capita waste generation has dropped steadily in recent years, and we are now generating 8 percent less waste per person than we did in 2000 (see chart 1 above). This is a materials management success that is not recognized by a narrow recycling goal, but it would be recognized under a reduced generation goal. More clearly outlining this type of progress in “Facts and Figures” would help the wider industry recognize and prioritize decreases in overall material usage.
Accounting for a shifting stream
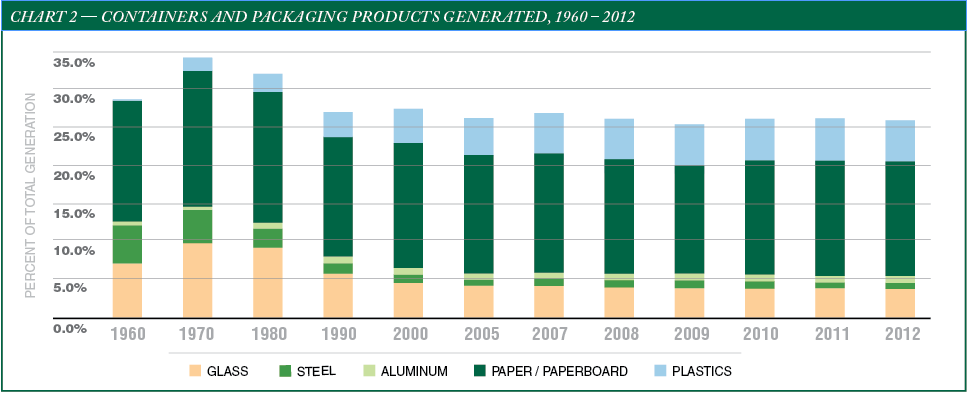
Furthermore, generation of packaging waste has decreased, even as our population has increased by 9 to 13 percent per decade. This is the result, in part, of the changing material composition in MSW (see chart 2 above). As we generate less newspaper and glass in MSW, lighter materials have started to make up a greater proportion of the stream, and the stream itself has become lighter on a per capita basis.
The paradox of course is that many of those lighter materials are not captured by current recycling programs, meaning that we are trying to boost recycling tonnages while recyclable materials themselves get lighter. This situation makes a recycling rate goal a poor singular measure of progress (though recycling rate numbers do remain important indicators of our efforts to realize the energy and greenhouse gas benefits of materials recovery).
The beverage container realm offers a good example of why we cannot rely only on traditional weight-based recycling rates to tell us the whole story about progress in sustainability and materials usage. If we measure U.S. beverage container recycling by weight, we find that recovery in that segment has increased by 18 percent over the last decade. But if we instead use volume as the metric, data shows beverage container recycling growing by 30 percent. The difference is attributed to container lightweighting. By looking at beverage container materials management through a lens that takes into perspective both recycling and the source reduction embodied by source reduction, we get the most accurate portrait of the full environmental impact associated with the packaging type.
The issue is exacerbated by the fact that data available on composition of MSW only includes products that have been in MSW for an extended period of time, such as bottles, cans and boxes. However, the kinds of products and packaging that we are buying changes continuously.
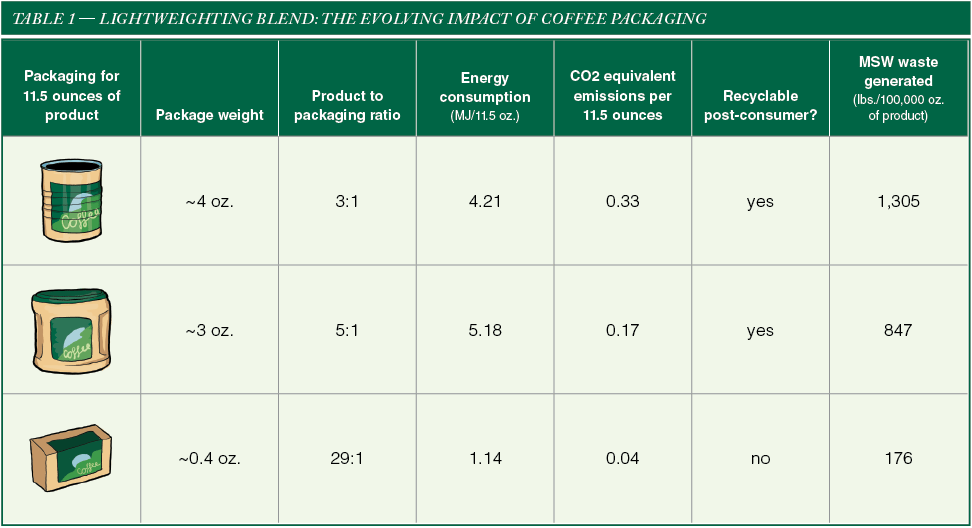
One example that is often cited is flexible packaging, which is an increasingly critical component in both consumer and transportation packaging – the category includes multi-layer laminates, bag-in-box packaging and pouches. Markets for recovered flexible packaging currently are currently limited, and MRFs are not designed to process most types of this material. However, because flexible packaging is so light when compared with many other forms of packaging, it can carry environmental benefits when the entire life cycle is taken into account. See the table below to see how the transition has played out in the coffee realm, where packaging has moved from tin cans to plastic jugs to lightweight capsules.
Adding depth to ‘Facts and Figures’
To allow industry dialogue and program assessment to keep pace with the evolving nature of materials composition and our own goal of looking at the complete picture of environmental impacts, we would be well-served by data that accounts for all the material nuances described above. In particular, there is a need for refining the analysis in the annual “Facts and Figures” report.
Currently, “Facts and Figures” uses two general terms to describe the fate of MSW tonnages: “recovered” and “discarded.” The “recovered” category includes material that has been recycled or composted, and “discarded” is used to cover everything else, including combustion with energy recovery.
SMMC believes that it’s important to recognize the differences between the many methods used to handle materials at end of life. For example, recycling, composting, conversion to fuel, combustion for energy recovery, and combustion without energy recovery all come with their own sets of environmental-impact factors. Combining these activities under terms like “recovery” or “discard” confuses the message.
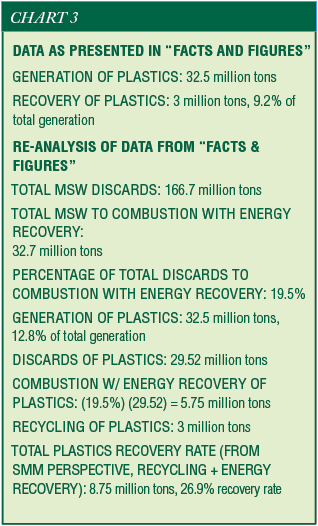
In creating its report last year, SMMC re-evaluated information provided in “Facts and Figures” about plastics in MSW in 2013. The EPA methodology defined “recovery” solely as mechanical recycling and tabulated a national recovery rate of 9.2 percent. In the SMMC assessment, “recovery” was defined as both mechanical recycling and combustion with energy recovery, and the “total recovery rate” was deemed to be 26.9 percent (see chart 3). The group believes this rate is more useful as the industry strives to express activities in SMM terms and strives for SMM-based goals.
All of the information needed to make the “total recovery rate” tabulation is provided in “Facts and Figures,” but SMMC believes that the EPA’s annual report could express the data in refined terms. Considering the value recovered through combined alternatives to simple disposal would better reflect life-cycle thinking. This value could be shown by clearly offering materials management data sets that account for the portion of materials sent to mechanical recycling, conversion to fuels (liquid and solid) and chemical feedstocks, combustion for energy recovery, landfilling with energy recovery, and combustion and landfilling without energy recovery.
 More relevant data, fewer unintended consequences
Clearly, more information on the changing distribution of materials in MSW – and a fresh perspective on analysis of those numbers – will be important as collection and recycling programs evolve to meet the challenges of material recovery. Including life-cycle impact estimates in this “connect the dots” approach to expansion and clarification of MSW data will be critical in achieving our national goal of reducing the environmental impact of materials use.
In the absence of such analyses, stakeholders involved in local collections programs may be making decisions that carry unintended consequences in terms of GHG benefits accrued or squandered, and they may be spending money to collect material with limited value.
Sara Hartwell is a former staffer at the U.S. Environmental Protection Agency and now works with the Sustainable Materials Management Coalition (SMMC). She can be contacted at [email protected].
The SMMC is a diverse, multi-year, public-private partnership, comprising representatives of business, academia, environmental and community organizations, and state government organizations. It also includes the participation of the U.S. EPA. SMMC provides advice to EPA and other stakeholders on sustainable materials management.