


During a July 16 AMP webinar, “AI-Driven Smart Sortation and Next Gen MRF Practices,” Horowitz noted that AMP’s method is to employ AI “throughout the system, to have that capability just about everywhere.”
“These systems are tied in through a software control layer to provide this pervasive level of monitoring and control,” he said. “We integrate that tightly into the system design. So a lot of what you see from us isn’t just saying, hey, here’s this traditional piece of equipment, we’re going to replace it with some AI thing. We’re actually re-architecting the entire MRF around these capabilities.”
Kevin Papich, director of facility operations, added that AI is often “mistakenly viewed as some kind of technological magic.”
“In reality, it’s merely a tool that makes every other tool around it smart,” Papich said. “The plant operating system and data analytics, when integrated with the power of AI and machine learning, allows us to view the entire facility as a manufacturing robot.”
When AMP first launched 10 years ago, it was mostly deploying single systems or clusters of systems. Now, it has over 400 systems deployed around the world, 85 different facilities use AMP technology, and the company is starting to create recycling facilities “from the ground up on artificial intelligence, rather than having AI kind of bolted in,” Horowitz said. That change was one driver behind the company’s recent rebrand.
The benefits
When you take a systems approach, Horowitz said the benefits start to compound. Right now, the recycling industry is facing several large challenges to increasing rates: commodity pricing volatility, operations and labor costs, labor shortages and equipment reliability.
“Despite all the innovations and technology, despite all the investment, despite all the effort of operators and different stakeholders in the industry, recycling rates have been stagnant for about 15 years here in the United States,” he said, adding that “it’s unfortunate when you have broader macro trends that should be supportive of the recycling industry.”
For example, there is broad societal concern right now about climate and resources, as well as potential market demand for pyrolysis and olefin materials, Horowitz said.
“This is the sort of thing that the industry should be able to tap into,” he added. “Largely it’s a missed opportunity.”
The vision at AMP is to use artificial intelligence to build “a different type of recycling facility, one that is more adaptable, one that’s higher performance and one that’s fundamentally more reliable,” Horowitz said. “The end goal here is to make an operator’s job easier and then make the fundamental economics of recycling better and easier to achieve, and also more consistent.”
Installing robotics and AI into existing facilities reduces some of the cost of manual labor, which Horowitz said often accounted for 30% to 50% of sorting costs. But designing a MRF around AI can not only reduce labor costs but also help put more material through the facility at a higher sorting accuracy.
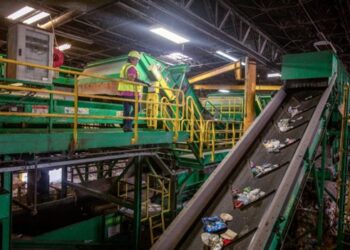
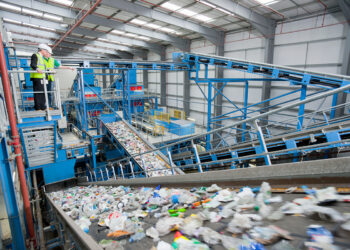
That kind of “smart sortation system” relies on “deploying AI pervasively throughout the facility to monitor pretty much every corner of the facility,” Horowitz said.
“When we do this, we have what’s essentially a full waste characterization that’s happening on a second-by-second basis,” he added.
It’s more accurate because AMP uses color cameras and AI to decide what every single item is, and then deciding the optimal time to sort it for the least amount of contamination.
Another key aspect of AMP’s full-facility designs is recirculation, where material passes under the cameras several times. That allows the system to choose the best moment to pick the items it is programmed for, to improve bale composition accuracy.
“Stuffing your system with a bunch of stuff going around and around, this ends up being a really important part of our designs because you end up having all sorts of options come out of it,” Horowitz said. “One is that AI has tight control over the purities that it’s going to extract.”
For example, the AI will flag an item it wants to pick – say, a PET bottle. But it calculates that with the items around or on top of that bottle, the odds of pulling in contaminants alongside that PET bottle are higher than the parameters operators have set. So it will wait until that bottle comes back around, then recalculate and decide again whether to pick it.
In addition, the system can monitor the percent of green and blue PET compared to clear PET that is moving through the line, Papich said, and if the resulting mix starts to approach a threshold – say, 20% colored PET – “the line itself will take mitigating action to send more colored PET either to another PET bunker or leave it in the recirculation system” in order to keep the right bale color.
The system can self-monitor and self-calibrate, Horowitz said. It can alert operators when a jam is starting to form, so it can be fixed without causing downtime. It can also be programmed to handle some decisions on its own.
“It’s looking at sort of these different material flows, different concentrations. It’s looking at things like, oh, there’s more paper here than I was expecting. Maybe I’m going to send an alert because I don’t know what to do and I need someone to check it out,” Horowitz said. “Or maybe I’m able to adapt myself, because this is expected behavior or I’ve seen it before.”
Getting that automation right took time, Horowitz noted, because if everything is automated sometimes the operators and the system “end up fighting each other.” AMP found that more feedback and crosstalk between the system and the operators was needed.
In terms of cost, color cameras cost less than many other automation systems, Horowitz said, so “for a lot of our facility designs, we deploy a lot of sorting systems, more than you might otherwise expect.”
And AMP can continue to push software updates onto the same equipment for years, he added, so you see “massive performance improvements that are regularly applied in the form of software updates.” In some cases, AMP has seen 10% to 20% throughput increases on the same hardware due to new software.
The company is also working on an infrared system to complement its AI color camera sorting, Horowitz said.