


Companies exported a little less recovered fiber and a lot less scrap plastic last year, recently released trade data shows.
U.S. exports of scrap fiber were down 8% in 2022, compared with the year before, and exports of scrap plastic fell 22%. That’s according to data from the U.S. Census Bureau, which recently published trade data for December, allowing Resource Recycling to analyze the full year 2022 data and compare it with prior years.
Generally speaking, U.S. scrap fiber and plastic exports have been decreasing since China began its National Sword campaign in earnest in 2018. At the same time, there has been a dramatic shift in where material is flowing.
National Sword meant tight restrictions on Chinese imports of baled scrap, but the country continues to allow imports of pulp produced from recycled paper. In fact, 2022 was the first year U.S. shipments of recycled pulp to China exceeded U.S. shipments of scrap fiber to the country.
Fiber exports fluctuate
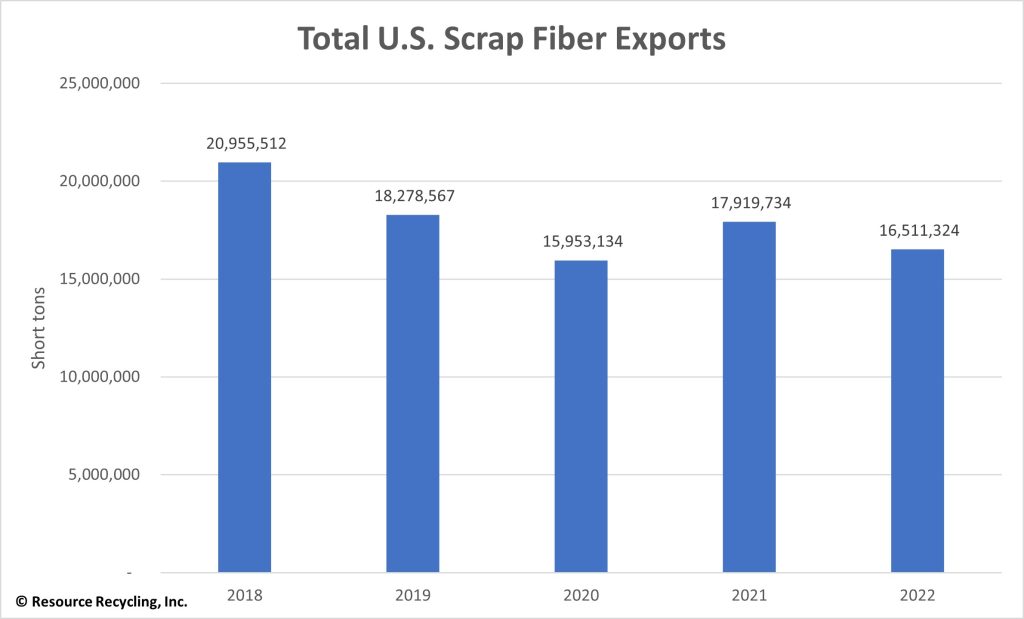
U.S. companies shipped out 16.5 million short tons of fiber (including OCC and various grades of paper) in 2022. The numbers marked the continuation of declines that began when China implemented its National Sword program.
The weight leaving U.S. borders dropped in 2019 and 2020, but it bumped back up by about 12% in 2021. In 2022, the weight fell again but remained higher than the quantity sent out in 2020.

The following chart shows total U.S. scrap fiber exports over the past five years (story continues below chart):
On a country-by-country basis, most of the top 10 destinations took in less U.S. material, with some experiencing huge drops. For example, shipments to China, Taiwan and Vietnam decreased 34%, 18% and 17%, respectively.
The following were the top 10 destinations for U.S. scrap fiber: India received 4.02 million short tons (down 5%), Mexico 2.54 million short tons (up 3%), Thailand 2.02 million short tons (up 2%), Vietnam 1.79 million short tons (down 17%), Taiwan 984,000 short tons (down 18%), Malaysia 931,000 short tons (up 4%), Canada 874,000 short tons (down 12%), South Korea 847,000 short tons (down 5%), Indonesia 557,000 short tons (down 3%) and China 355,000 short tons (down 34%). All other countries combined received 1.59 million short tons of America’s fiber bales (down 20%).
The following chart shows the changes (story continues below chart):
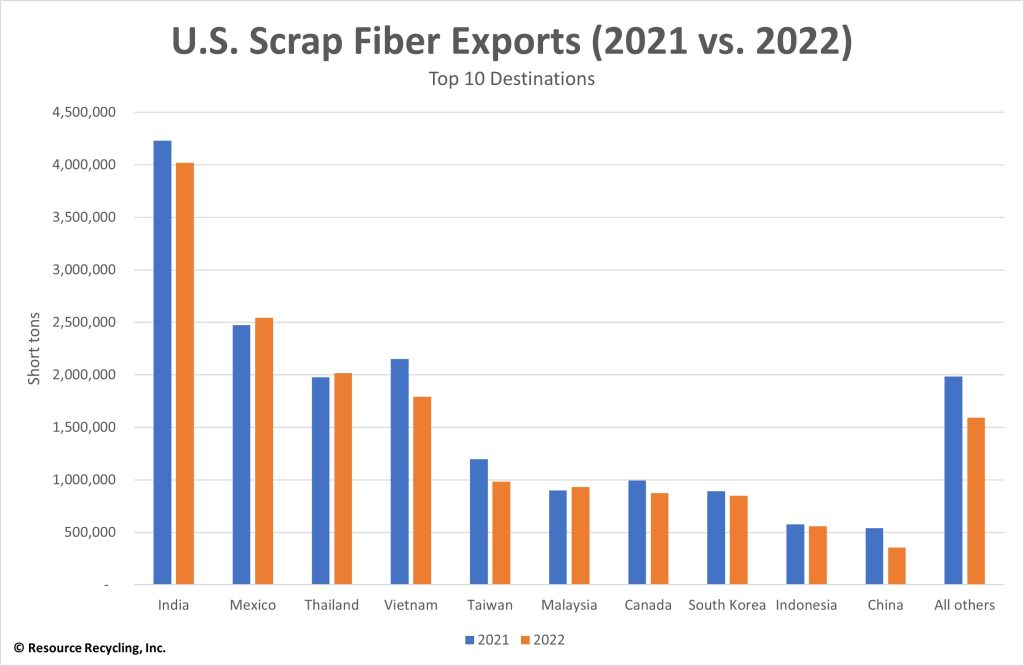
All of the same countries that were on the top 10 destinations list in 2021 landed in the top 10 again in 2022, although some moved slightly up or down in the order.
The data above does not include recycled pulp. Some companies take in bales of recovered paper and pulp the materials at U.S. mills, and then they dry and ship the recycled pulp to Chinese factories, which convert it into finished products. Mills in the U.S. have been shipping more and more recycled pulp to Chinese factories since National Sword started in 2018.
In 2022, the U.S. exported 538,000 short tons of recycled pulp, up 17% from the year before. China took 465,000 short tons, or 87% of that material. That’s way more than any other country. The No. 2 destination was Canada, which took 50,000 metric tons of the U.S.’s recycled pulp.
Plastic exports fall by over one-fifth
Trade data shows the decline in U.S. scrap plastics exports accelerated for the second year in a row.
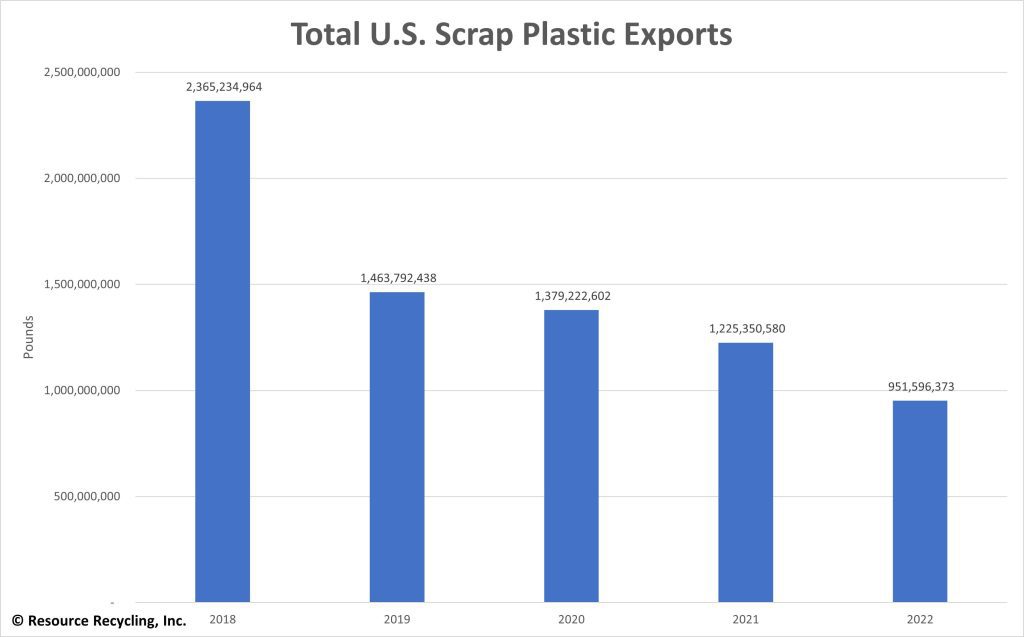
Shipments of scrap plastics to foreign destinations totaled 952 million pounds in 2022, down 22% from the prior year. The 2021 number was down 11% from 2020, which was down 6% from 2019.
Exports have been falling ever since China’s National Sword campaign began in earnest at the beginning of 2018. In 2017, shipments totaled about 3.68 billion pounds. They plummeted to 2.37 billion pounds in 2018, 1.46 billion pounds in 2019, 1.38 billion pounds in 2020 and 1.23 billion pounds in 2021.
The following chart shows total U.S. scrap plastic exports over the past five years (story continues below chart):
On a country-by-country basis, last year brought some significant swings in weights. For example, exports to Vietnam and Malaysia dropped 61% and 57%, respectively, but shipments to Germany and Pakistan increased 58% and 38%.
The following were the top 10 destinations for U.S. scrap plastics: Canada received 316 million pounds (down 16%), Mexico 186 million pounds (up 1%), India 97 million pounds (up 5%), Malaysia 78 million pounds (down 57%), Indonesia 45 million pounds (down 26%), Vietnam 31 million pounds (down 61%), Germany 28 million pounds (up 58%), Turkey 24 million pounds (down 21%), El Salvador 22 million pounds (down 24%) and Pakistan 14 million pounds (up 38%). The rest of the world took in a total of 110 million pounds (down 33%).
The following chart shows the changes (story continues below chart):
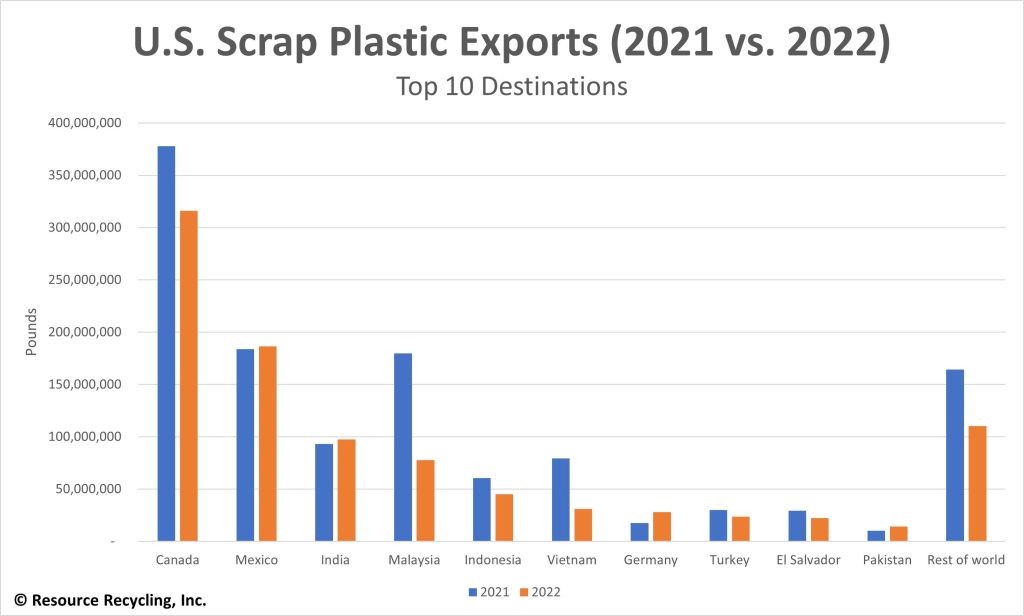
The top 10 list changed from 2021 to 2022. Hong Kong and Taiwan fell off the list, and Germany and Pakistan climbed onto it.