According to the U.S. EPA, 30% to 40% of the food supply in the U.S. is never eaten, an issue the EPA has been trying to address more aggressively of late and the subject of “From Farm to Kitchen: The Environmental Impacts of U.S. Food Waste,” published by the agency late last year. To help bring more awareness to food-recovery gaps, the EPA has also shifted its methodology to measure food loss and waste (FLW). From 1960 through 2017, the agency’s annual “Facts and Figures” dataset included only food from the retail and consumption supply chain stages that was sent to landfills, incinerators and compost facilities. However, more recently, the EPA has also measured tonnages that move to six additional pathways: donation, animal feed, anaerobic digestion/co-digestion, land application, sewer/wastewater, and bio-based materials/biochemical processing. The graph below shows the amount of U.S. FLW per capita since1960. The shorter, higher line correlating with more recent years shows how the number grows by about 50% when those additional FLW pathways are included.

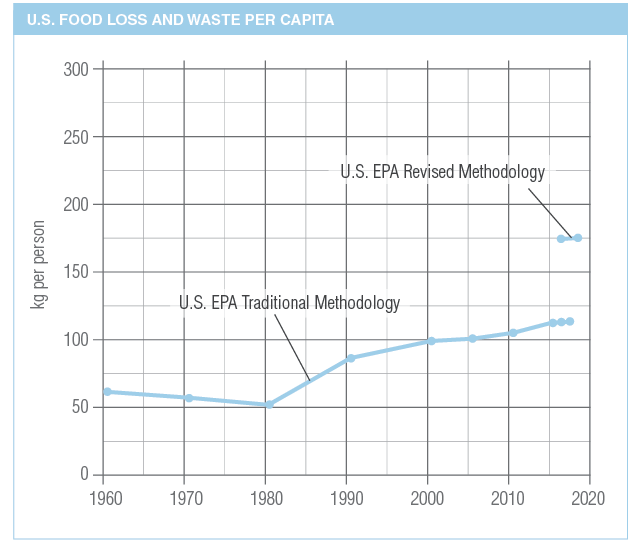
Source: “From Farm to Kitchen: The Environmental Impacts of U.S. Food Waste,” U.S. EPA, November 2021.
This article appeared in the January 2022 issue of Resource Recycling. Subscribe today for access to all print content.