
U.S. exporters shipped out 773 million pounds of scrap plastic in the first half of 2019. | aapsky/Shutterstock
Federal trade statistics released last week show U.S. export volumes for the first six months of 2019. Recycled plastics have seen a major drop when compared with figures from a year ago.
Plastic shipments collapse
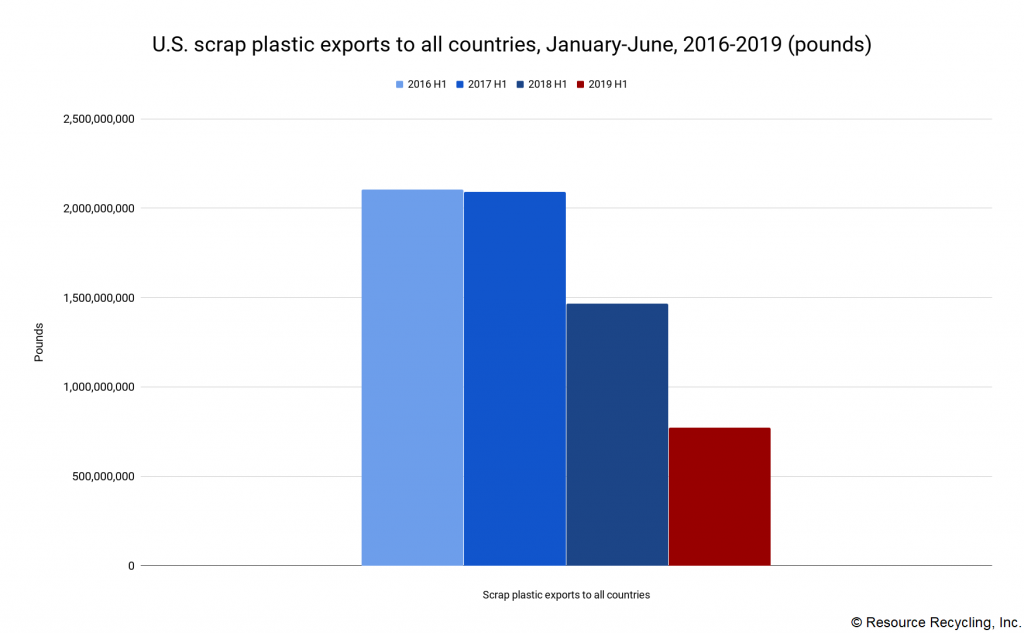
U.S. exporters shipped out 773 million pounds of scrap plastic in the first half of 2019, down 47% from the nearly 1.5 billion pounds exported during that period last year.
The 1.5 billion pounds in 2018 was already down from 2.1 billion pounds in 2017, a decrease of about 29%.
U.S. exports of the material have been heavily impacted by multiple factors in recent years – first by China’s ban on most scrap plastic imports and then by a rash of import restrictions implemented throughout Southeast Asia, as countries in that region tried to stem major increases in imports of material displaced by China’s ban.
The latest figures indicate that the plastics recycling disruption is ongoing, and there are many indications the export situation will only experience more uncertainty. For instance, this decrease comes before the impact of the Basel Convention changes in scrap plastic shipping rules. And additional countries are publicly denouncing scrap plastic imports and calling for regulatory reform.
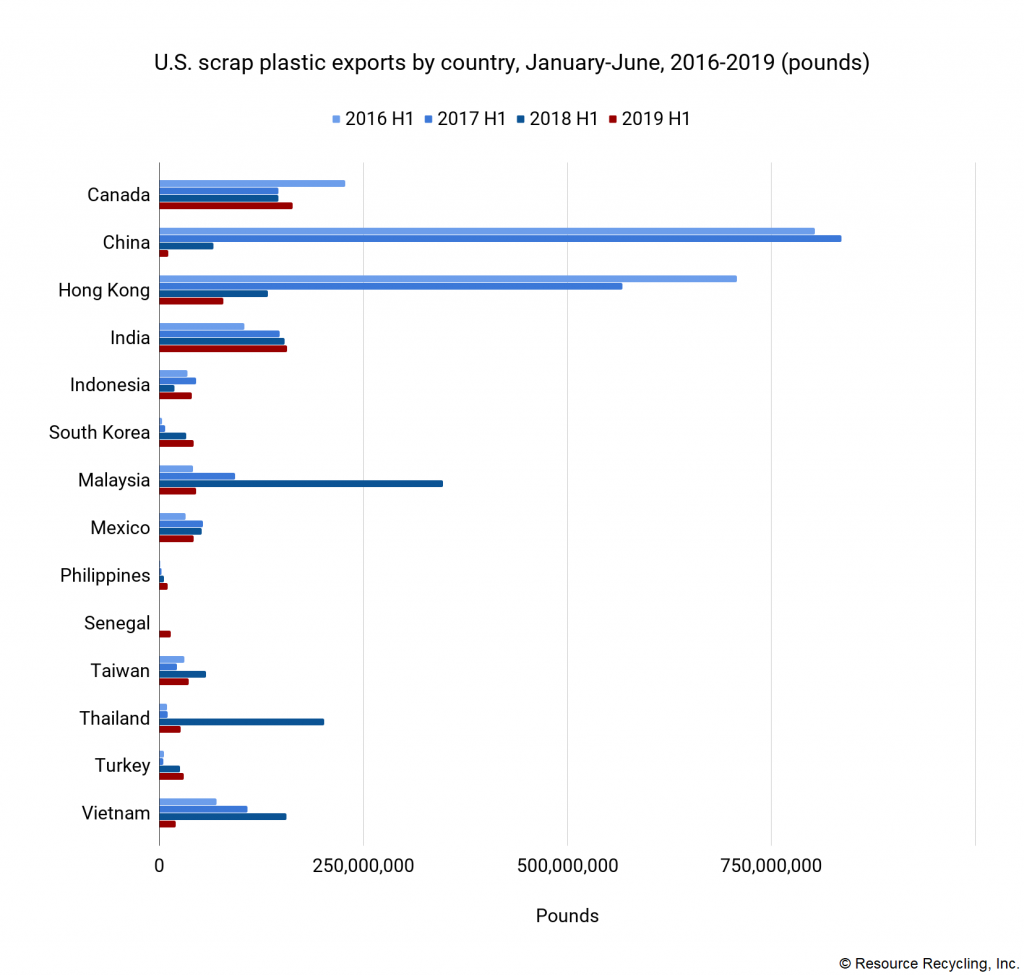
For the first half of this year, the largest buyers of U.S. scrap plastic were Canada (163 million pounds), India (156 million), Hong Kong (78 million), Malaysia (45 million), Mexico (42 million), South Korea (42 million), Indonesia (40 million), Taiwan (36 million), Turkey (30 million) and Thailand (26 million).
Together, those countries brought in 85% of the scrap plastic shipped out of the U.S.
By grade, 43% was PE, 35% was mixed plastics, 12% was PET, 5% was PS and 5% was PVC.
(Story continues below charts.)


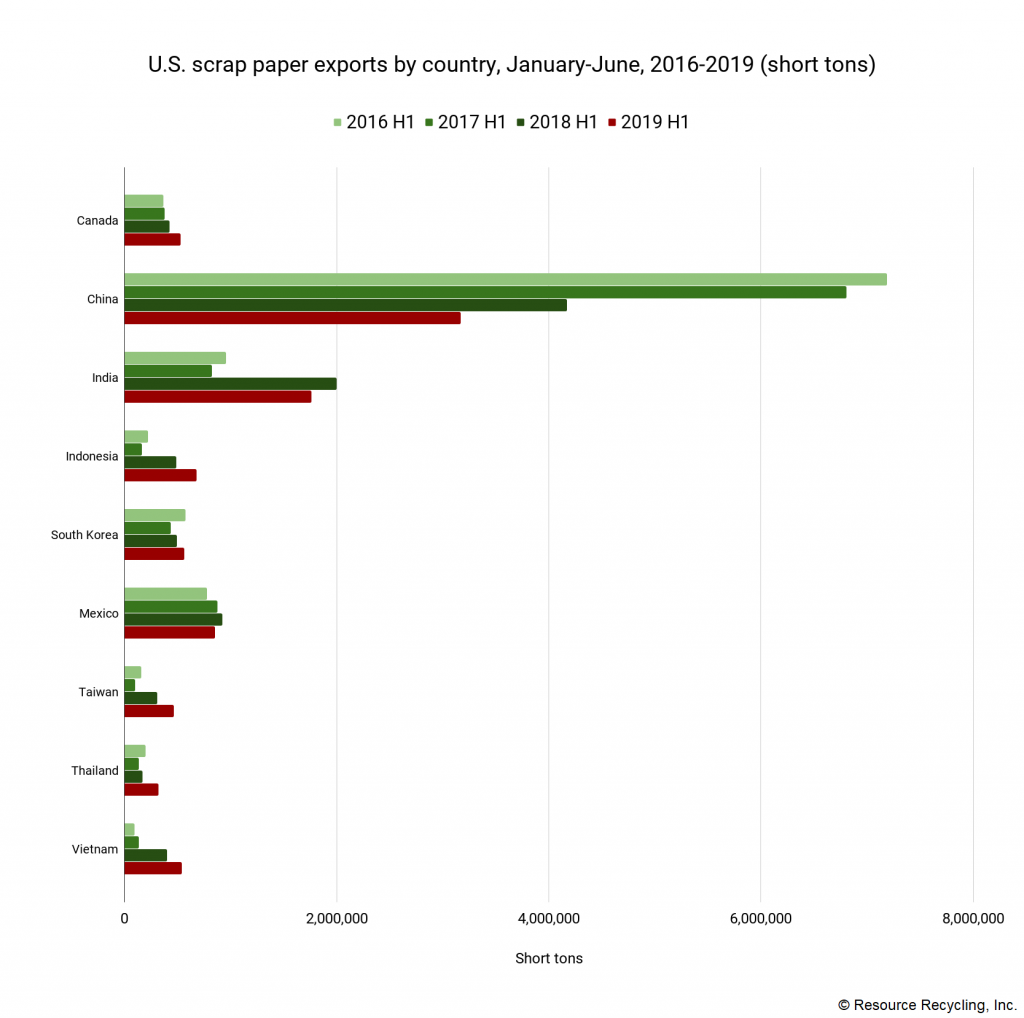
Paper exports relatively stable
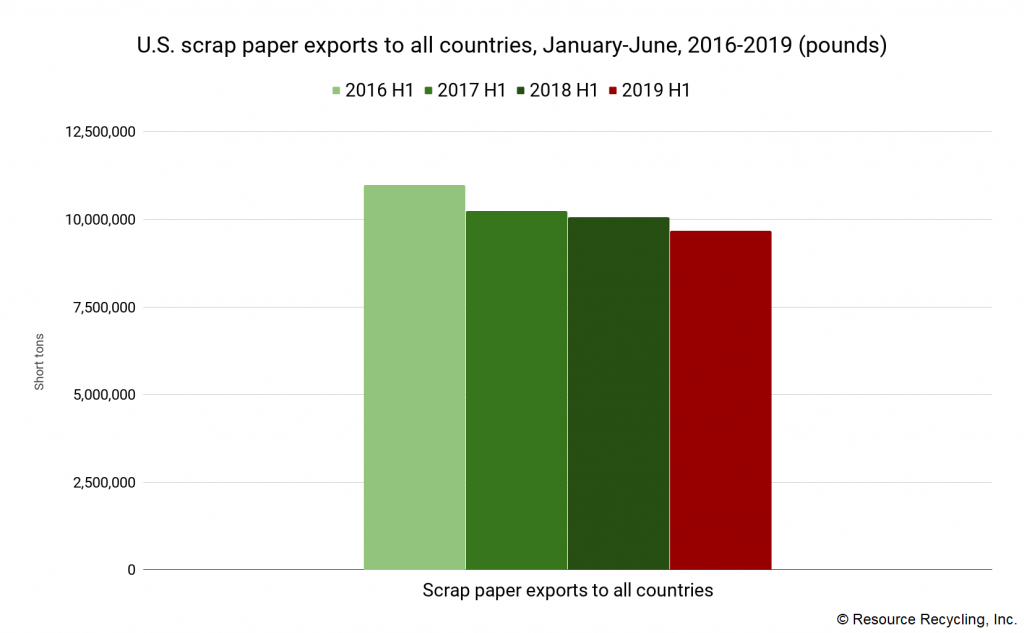
Fiber exports during the first half totaled 9.68 million short tons, down from 10.1 million the year before. That represents a fall of 4%.
The relative stability is primarily due to China’s continuing imports of OCC from the U.S. While China’s imports of U.S. recovered fiber were down by about one-quarter year over year, the country remained by far the largest importer, with OCC making up 71% of the shipments.
The stability is also attributable to alternative markets upping their intake of U.S. fiber, which has, with slight exception, largely avoided the public pressure that has appeared when countries increase their imports of scrap plastic. For instance, Canada, Indonesia, South Korea, Taiwan, Thailand and Vietnam all brought in significantly more U.S. recovered fiber in the first half of 2019 than they did last year, offsetting decreases in shipments into China, India and Mexico.
By country, the largest buyers of recovered fiber from the U.S. were China (3.17 million short tons), India (1.76 million), Mexico (852,000), Indonesia (680,000), South Korea (565,000), Vietnam (539,000), Canada (530,000), Taiwan (462,000) and Thailand (319,000).
These countries imported 92% of recovered fiber that was exported from the U.S.
By grade, OCC made up 59% of all U.S. recovered fiber exports, mixed paper contributed 15%, and other grades, including newsprint and high-grade deinking papers, made up the remaining 26%.

- Malaysia fully halting US plastic scrap imports
- Some tariffs suspended, metal duties coming this week
- Tariffs on Canada and Mexico take hold


