
This article originally appeared in the September 2018 issue of Resource Recycling. Subscribe today for access to all print content.
While millions of tons of recovered materials are handled annually by materials recovery facilities (MRFs), the industry has always struggled to make clear assessments about these plants in combination.
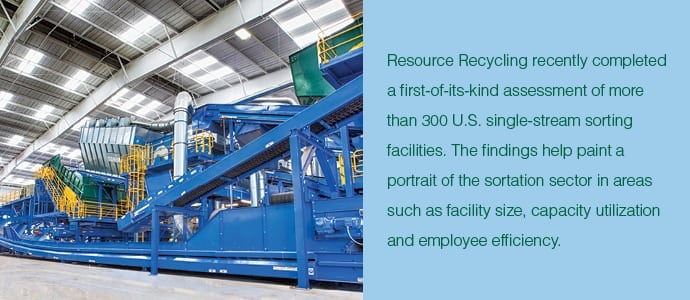
To help fill this data gap, Resource Recycling has completed an assessment of more than 300 U.S. single-stream sorting plants. Several of the research findings fly in the face of assumed knowledge in the recycling field.
Resource Recycling has maintained a database on sorting plants for the past decade. We cross-checked and updated the database with additional information from Governmental Advisory Associates, a consulting company that focuses MRF data. We then sought data confirmation from the largest producers of separation and sorting equipment and a handful of MRF operators (both publicly traded firms and private companies).
Several limitations exist for this data set, which includes 334 U.S. facilities. Limitations include:
- We sought information only on the size of the plant in square feet, and not the size of the whole site.
- We strove to acquire actual throughput for each plant but some plant owners only supplied the design capacity.
- Some MRFs have operated at their sites for many years but have been upgraded. We only used the date of the last major upgrade.
- Capital costs have not been adjusted for inflation. Also, we were only able to acquire cost data for 48 percent of the facilities.
- We did not include labor data for MRFs employing disabled workers or inmates.
Despite those realities, the information gathered helps us draw some useful conclusions about the sortation field today.
A handful of equipment makers dominate the field
Although about a dozen firms have manufactured, sold and installed sorting systems (not including balers) in the U.S. in the past few decades, the equipment market is dominated by a handful of U.S., Canadian and European equipment makers. Approximately 95 percent of the throughput in today’s U.S. MRF environment is processed using equipment sold by just five producers, with the top two makers having a combined 63 percent of the market.
MRF size is not closely related to throughput
MRFs with the same throughput can often vary in size by a magnitude of two or three. In some areas of the country, such as the Southwest, MRF builders were able to acquire large plots and construct roomy plants with large tipping floors and numerous loading docks. In comparison, in populous areas of the East Coast, industrial land is scarce, and a MRF operator building a facility with comparable throughput would need to stack sorting equipment, use a smaller tip floor, immediately load outbound trailers and take other similar steps to be more efficient in use of space.
The boom in MRF building is over
Most urban and suburban American homes are now served by commingled collection. This material is handled by more than 300 existing facilities, and fewer and fewer new plants are being built. Our data suggests the peak in MRF construction (or major rebuilds) came in 2012. However, the data set also shows that while few new plants are on the horizon, upgrades are occurring at a rapid pace, especially as MRF owners install new optical separation units.
“MRFs per state” is a worthless measure
A large number of older, smaller MRFs, especially those in New England and the Mid-Atlantic regions, are single-stream facilities that were originally designed to handle two streams (containers and fibers). As recycling interest grew nationwide, subsequent MRFs were fewer in number but much larger in throughput. This means the number of MRFs in one state tells us little. That said, the top three states in terms of number of facilities (California, Florida and New York) represent one-third of all U.S. MRFs.
Modern MRFs can be very large
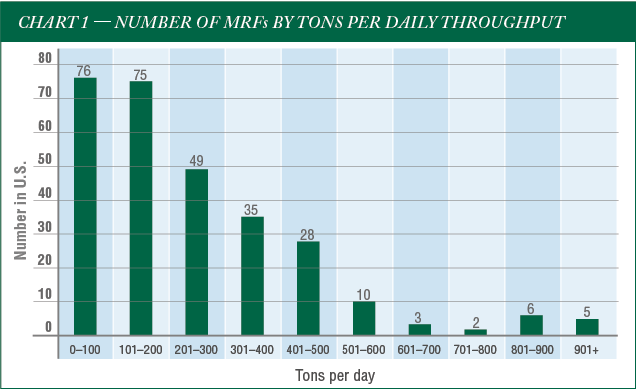
As you’ll note on Chart 1 below, more than two-thirds of today’s MRFs have a daily throughput under 300 tons. However, the five largest MRFs in the U.S. have a combined throughput that’s higher than that of the 76 MRFs with throughput under 100 tons per day. Another notable stat: The 26 MRFs with throughput over 500 tons per day handle 14,000 tons per day combined.


MRFs can handle a lot more material
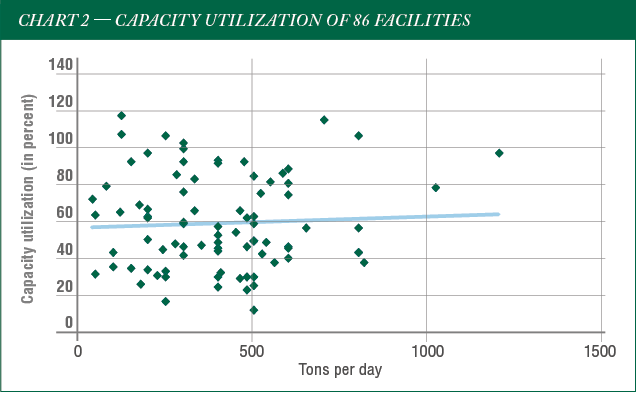
We obtained data on the design capacity and the actual throughput for 86 plants. This allowed us to determine that the typical MRF has the capability to handle one-third more material than it currently does. Chart 2 shows the daily throughput of each of those 86 MRFs as well as their utilization percentage. A handful of MRFs actually operate above capacity, but most run at below 80 percent capacity utilization. As the solid blue trend line demonstrates, the average capacity utilization is around 60 percent.
MRF plants vary widely in size
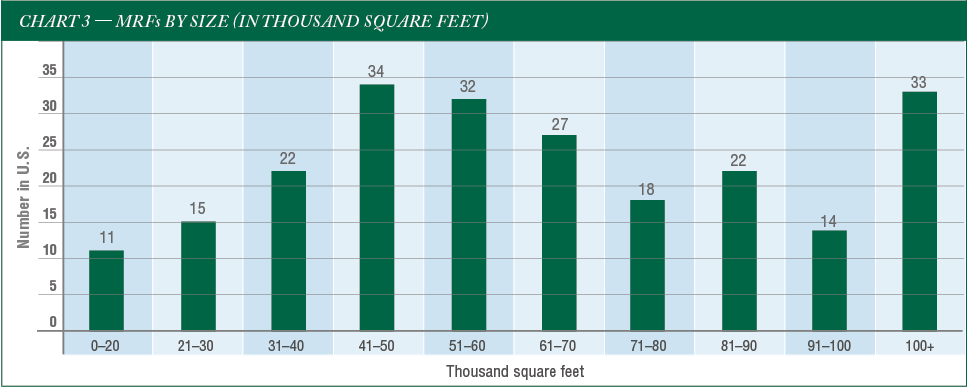
When looking at facility size, as shown in Chart 3, we see two trends. First, the majority of MRFs have a square footage between 30,000 and 70,000 square feet. Second, more than 30 MRFs are larger than 100,000 square feet, with four being over 200,000 square feet.

Why is there only a weak connection between MRF size and throughput?
Interviews with MRF owners and designers indicate bale storage is a key factor in facility size. Some operators prefer or are provided significant on-site bale storage while other MRF owners need to load bales for shipment as quickly as possible, with few bales stored in the plant. Thus, plant-to-plant comparisons in terms of square footage and throughput need to take the bale storage area into account.
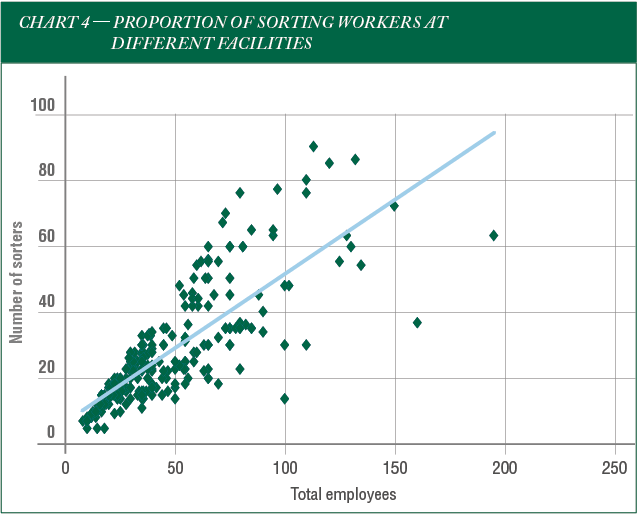
A consistent ratio exists in terms of the number of sorting personnel and total MRF employment
Chart 4 suggests that regardless of total number of employees at a plant, the percentage of those workers engaged in sorting stays constant. This will be a statistic to continue to watch as plants get more automated in the years ahead. Some MRF experts predict robotic technology and other innovations will allow facilities to rely less on manual sorters. It will be interesting to see if such a shift is seen proportionally across MRFs of varying sizes and employee counts.

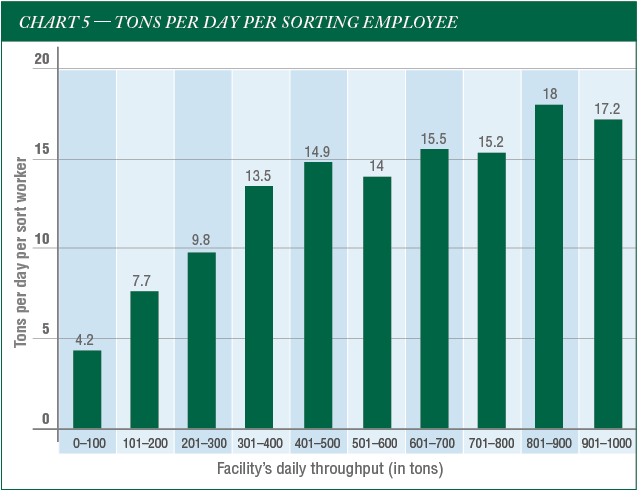
Big MRFs are far more labor efficient than smaller facilities

Large MRFs are often twice as efficient than smaller plants in terms of the throughput per sorting employee. Chart 5 indicates sorters in large plants have an output about three times greater than sorters in small plants.
Putting the pieces together
This analysis of MRF metrics has several important takeaways.
First, as mentioned earlier, most MRFs operating today could handle about one-third more tonnage using existing processing equipment. In other words, initiatives to add materials, boost participation or expand service areas would not necessitate much, if any, new capital investment, except possibly for additional loaders and forklifts. Personnel levels, of course, would rise.
Second, MRFs vary widely in size, throughput, employment and cost. That said, the average MRF looks like this: 245 tons per day of throughput; 65,400 square-foot plant; 27 sorters each handling 9.8 tons per day; and construction cost of $9.4 million.
Third, MRFs are getting larger. We’ll thus see more smaller, older plants being closed, as processors move more toward a hub-and-spoke system employing large, more efficient plants.
Lastly, workers are being replaced by equipment, especially by optical sorters, and more personnel are moving to quality-control duties from sorting.
It’s also important to note most of the research used to form the analysis outlined here was conducted before China began implementing its National Sword policy, which has caused huge shifts in the market for recovered materials and forced more stringent contamination requirements onto sellers of bales. With China’s move now influencing policies in other overseas markets, we will very likely see changes in the numbers defining U.S. MRFs as operators adjust in the years ahead.
Jerry Powell is the founder and executive editor of Resource Recycling. He can be contacted at jpowell@resource-recycling.com.