
In April, the most recent month for which figures are available, scrap plastics exports totaled 401.67 million pounds, an increase of 11.8 percent from March 2016 export levels. That marked the third straight month of volume gains over 10 percent.
When matched against April 2015 levels, however, the volume of plastic scrap exports in the month was down by 10.7 percent.
Meanwhile, the weighted price of recovered plastic exports in April 2016 was 16.8 cents per pound, down 2.0 percent from its March standing. That price-per-pound figure was down 8.7 percent from the price level in April 2015.
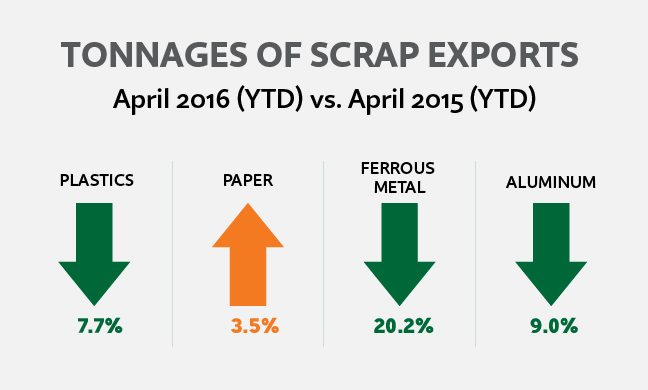
With 1.34 billion pounds of scrap plastics exported through the first four months of 2016, the volume was down 7.7 percent from the April 2015 year-to-date (YTD) figure. At 17.0 cents per pound, the average price through April 2016 was down by 8.6 percent from its 2015 YTD standing.
As for other exported materials, recovered paper exports were up slightly through the first four months of 2016. Through April, 6.63 million metric tons were exported, a 3.5 percent increase from April 2015 YTD levels. At $150 per metric ton, however, the weighted average price of exported recovered paper through April was down YTD by 5.2 percent.
The 4.42 million metric tons of ferrous scrap exported through April 2016 amounted to a 20.2 percent YTD decrease. This was the fourth month in a row of YTD declines over 20 percent in the ferrous category. At $332 per metric ton, the weighted average price of exported ferrous scrap was down 21.1 percent from April 2015 YTD levels.
Finally, the 920.09 million pounds of aluminum scrap exported in 2016 through April amounted to a 9.0 percent decrease compared with the April 2015 YTD figure. At 62 cents per pound, the average price of exported aluminum scrap through April 2016 was down by 17.3 percent compared with last year’s total through April.
This report is based on statistics provided by the U.S. Department of Commerce and the U.S. Department of Labor – Bureau of Labor Statistics.